
Do you have a member focused ROA?
Whenever I attend a conference and talk with a credit union executive or board member, the first three things they use to describe their credit union are asset size, return on assets and net worth. It always strikes me as odd the fixation with rate of return. Return on assets is profit extracted from members in the current year. Net worth is cumulative profit extracted from members in prior years. I thought the objective was to create value for members instead of boasting about how much profit you have extracted from them!
Credit unions serve a dual mandate. They need to generate enough return on assets to stay adequately capitalized, but at the same time, must create value for members, which comes at the expense of return on assets. Given this reality, where should the credit union set the bar in terms of expectations?
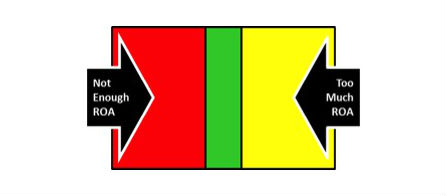
Fortunately, the answer to the dual mandate riddle is easily answered and can be illustrated using the simple graphic above.
Let’s start on the far right side of the graphic. A credit union that is performing in this area has a return on assets that is too high; it is extracting too much profit from its members and hoarding it as net worth. It needs to figure out ways to return more value back to members in the form of favorable pricing, supplemental dividends, etc.
A credit union that is performing on the far left side of the graphic is generating a return on assets that is too low; it cannot sustain itself for an extended period of time operating here. It must figure out ways to increase productivity, improve product mix, reduce member favorable pricing and/or reduce provision for loan loss expense.
As I am sure you have surmised by now, credit unions that perform in the middle of the graphic have found the optimal return on assets – one that generates enough profit to keep the “financial house” in order, but at the same time, avoids extracting excessive levels of profit from members.
The math behind the graphic is remarkably simple. Multiply the credit union target net worth ratio by its appetite for asset growth and you have identified the optimal return on assets. For example, a credit union that desires to maintain net worth at 10% and has an annual appetite for asset growth of 5% needs a return on assets of 0.50% to maintain net worth. Add a safety margin of 0.20% and you have identified the optimal return on assets – somewhere between 0.50% and 0.70%. Anything below that amount and net worth will decline; anything greater than that and excessive levels of profit are being extracted from members and hoarded away as capital.
At the end of the day, the optimal, member focused ROA provides a way for both the management team and board of directors to agree upon an acceptable rate of return.