
The cost of employing someone in the United States has increased every year. For the last quarter century, that cost has risen without exception—through recessions, a financial crisis, a decade of near-zero rates, and a pandemic. Credit unions feel it acutely. They are also managing another line moving in the opposite direction—yield. Most institutions are treating both as though they carry equivalent risk. They do not.
I looked at 24 years of credit union compensation data. It was startling. As the industry struggles to determine what makes a credit union 'small', let me suggest that we are all small businesses. Every institution in this industry operates without the scale that large financial institutions use to absorb structural cost pressure. When compensation rises without exception and yield cycles with the Fed, there is no size that makes that asymmetry comfortable—and the smaller the asset base, the thinner the buffer when yield falls.
One line that does not move
The median U.S. household has 2.5 members. The median $300M credit union has 60 employees. The Kaiser Family Foundation (KFF) data shows roughly 76% of eligible employees enroll in coverage—but only about 40 to 45 percent elect family-tier plans. This is important because of the structure. Almost every credit union under $300M in assets is operating near or below a 100-lives threshold that materially changes healthcare costs. Most credit unions do not have a plan to offset the rising expense.
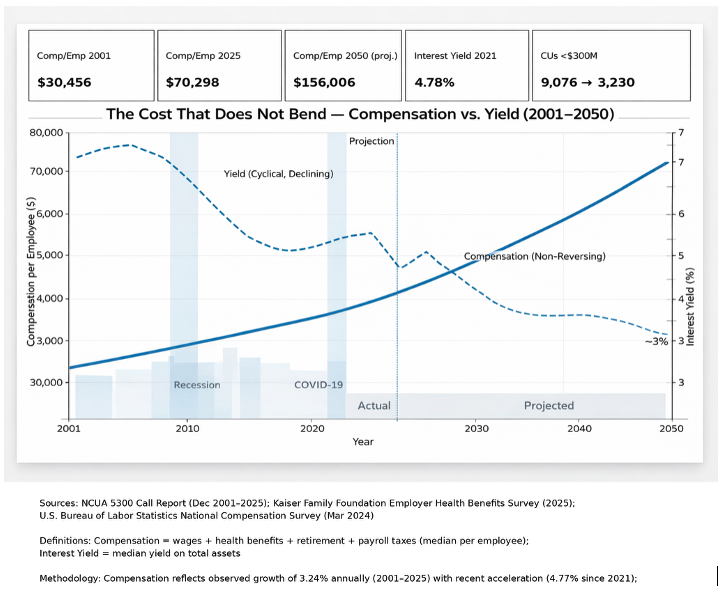
In December 2001, the median sub-$300 million credit union paid its employees $30,456 in total compensation and benefits—wages, health coverage, retirement contributions, and payroll taxes combined. By December 2025, that figure stood at $70,298.
It increased in every reporting period across those 24 years. Not once did it decline—not during the dot-com contraction, not through the 2008 financial crisis, not through a decade of near-zero rates, not through COVID. Not by a dollar. Not in any environment.
The KFF’s 2025 Employer Health Benefits Survey puts family health premium growth at 60 percent since 2015, with annual increases of 6 to 9 percent. Benefits expense compounds like a price index—it does not reset, it does not negotiate, and it does not respond to the rate environment.
One line that does not hold
Interest yield also does not negotiate. The median credit union earned 6.82 percent on its assets in 2001. By 2025—after the most aggressive rate hiking cycle in four decades—that figure stood at 4.78 percent. Each cycle since 2001 has peaked lower than the one before it.
The 2019-to-2021 period is the proof. As the Federal Reserve collapsed rates to near zero, the median institution's interest income fell 16.3 percent in two years. Its compensation and benefits expense moved from $438,491 to $438,704. That is after cost-cutting, staff reductions, and reduced hours. Revenue bent sharply. Cost did not move.
The chart below plots compensation per employee in dollars on the left axis and interest yield as a percentage on the right, from 2001 through 2025 with projections through 2050. One line climbs without interruption. The other cycles—each peak lower than the last, each trough cutting deeper into the margin. When those two lines diverge long enough, credit unions disappear.
The credit unions that are gone
In 2001, 9,076 federally insured credit unions operated under $300 million in assets. Today there are 3,230. The decline has followed a nearly straight line for 24 years—no reversals, no pauses, no recoveries. If that line holds, approximately 1,100 institutions remain by 2050.
Many credit unions that disappeared were not undone by credit quality or governance failure. They were absorbed by a cost structure that compounded in one direction while their revenue base cycled in both. The survivors adapted—cutting headcount, growing balance sheets, and benefiting from the rate recovery through 2025. Some acquired other credit unions. There are a finite number of levers to pull. Reaction is a poor substitute for disciplined strategy.
The math is not complicated
As of Q4 2025, the median credit union was earning 3.49 percent on its combined investment and cash portfolio. That is the current rate environment—the best in over a decade. Rates are now, more than ever, a global consideration with increased pressure and volatility. Peaks will not hold when the cycle turns.
The median credit union carries approximately $16 million in investable assets—42 percent of its balance sheet sitting in instruments that yield less than four cents on the dollar in the most favorable rate environment of the past decade. The equation is straightforward: a fixed and rising obligation, funded by a variable and cyclically shrinking yield. When the yield falls below the growth rate of the obligation it is meant to offset, the gap widens every year regardless of what management does. The only durable way to close it is to change the yield.
Credit unions that solve this structurally free the management attention and operating capacity the compensation line has been consuming for two decades. Not a better ratio. The ability to run the rest of the business.
Leaders must see what has been muted—compensation costs will only increase. Credit unions must find better yield. The difference between 3.49 percent and 7 percent on a $16 million portfolio is approximately $568,000 per year in incremental income. That is a significant difference for most credit unions.
NCUA §701.19 gives federal credit unions explicit authority to prefund employee benefit obligations—converting a compounding expense into a managed asset generating a return.
CU Benefit is a CUSO designed specifically for this challenge—helping credit unions nationwide unlock their capital using prefunding strategies to increase yield on more than $653 million with participating credit unions achieving average returns in the 6 to 8 percent range on capital that was previously earning much less.
When interest income falls in the next rate cycle—and it will—does your compensation cost structure compress with it? If the answer is no, you are carrying asymmetric risk on both sides of your income statement simultaneously. The data suggests this has been true for at least a quarter of a century, and the credit unions that could not manage it are no longer with us.
Our industry was founded by people who thought differently to solve old problems. The problem in front of us today is not new. We just need to start thinking differently again.
If you want to learn more benefits prefunding strategies, visit cubenefit.com or totalbenefitprefunding.com/resources.