
When consumers launch, join, and use credit unions, they make both financial and social choices. Financially, they are seeking favorable pricing, inclusive underwriting, a broad range of products and services, and quality member service. Socially, they are seeking to participate in democratically run, cooperative endeavors. As members of cooperatives, credit union members vote in elections and serve—most often as unpaid volunteers—in various committees, including boards of directors.
Credit unions, and their boards, evolve over time. In recent decades, many credit unions have evolved from smaller, volunteer-run institutions into far larger, professionally managed ones. At the same time, women and minorities have gained increasing representation across political and economic institutions in which they had historically been denied access. As community-based institutions, credit unions have a long history of forming grassroots organizations that offered both financial access and board representation to communities that faced discrimination elsewhere.
What about today? Where do credit unions stand in terms of women’s and minority representation in their boards? And are there strong links between board diversity and various measures of credit union performance?
To explore these issues, our report Credit Union Boards of Directors: Board Size, Gender, Race, and Institutional Performance, 2012-2021 quantifies both the current state and recent evolution of board sizes as well as women’s and minority representation on credit union boards. We also explore the extent to which there are (or aren’t) links between board composition and several key measures of member-centric and financial performance.
The key measures of performance we explored include loan and deposit benefits (how well interest rates compare with those of banks); loans per assets and loan delinquencies (as measures of credit inclusion); product breadth; and growth, return on assets, and capital ratios (as measures of financial sustainability, profitability, and solidity).
Board Size
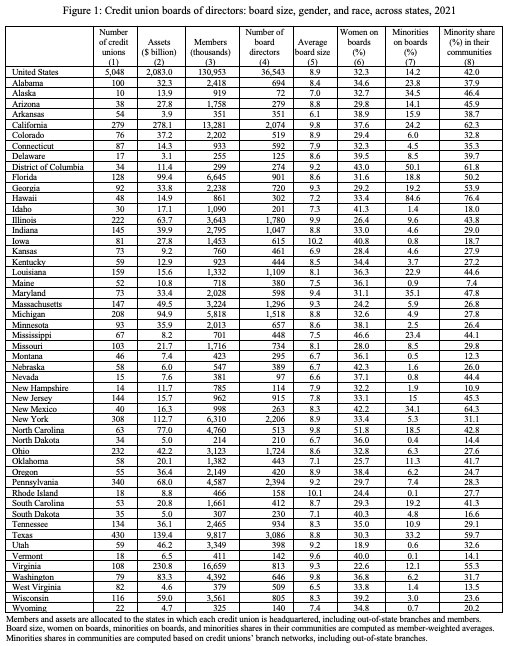
Regarding board size, we found that with 36,543 directors across a total of 5,044 credit unions, boards averaged 7.2 directors in 2021. Board sizes range somewhat, but 95% of boards have between five and eleven members. Smaller credit unions have smaller boards, but average board sizes do not differ markedly across asset size ranges. For instance, very small credit unions (i.e., with under $10 million in assets) average 6.4 directors, while very large credit unions (i.e., with over $10 billion in assets), have more than one thousand times the assets, but average only 10.3 directors.
As most members belong to larger credit unions, we also compute a member-weighted average board size, which is 8.9 directors for the average credit union member. Performance at credit unions with smaller vs. larger boards can vary widely. However, upon closer inspection, our statistical analyses do not find board size to be a key driver of credit union performance. Larger credit unions, on average, have both larger boards and perform better across many measures of member-centric and financial performance. However, increasing a credit union’s board size would not mechanically yield the performance associated with larger asset size.
Women’s Representation on Credit Union Boards
Regarding women’s representation on boards, we estimate that with 12,758 women among 36,543 directors across the industry, there were 2.5 women per board, accounting for 35% of boards. This is somewhat above the average for corporations in the Russell 3000 index (27%), but substantially below the percentage of female members in credit unions (about 50%).
A large fraction of credit unions (29%) holding a large fraction of credit union assets (25%) has boards that are close to gender parity (i.e., women’s representation between 40% and 60% in boards). However, credit unions with boards with less than 40% women’s representation are far more common (at 56% of credit unions and 69% of assets) than those with under 40% men (15% and 6%). Credit unions with no women’s representation are still somewhat common, at 10% of credit unions, with 3% of assets.
Women’s representation is higher in smaller credit unions, ranging from 31% among very large credit unions to 43% among very small ones. During 2012–2021, women’s representation increased steadily across asset size ranges, increasing the most among the largest credit unions (which had the least women’s representation) from 23% to 31%, or by 8 percentage points. It increased the least among the smallest credit unions (which had the most women’s representation) from 41% to 43%, or by 2 percentage points. During this period, women’s representation overall has increased from 33% to 35% on an unweighted basis and from 26% to 32% on an asset-weighted basis.
Across states, nine had more than 40% women’s representation, 41 had between 20% and 40% women’s representation (which often involves having at least two women on boards), and one state had under 20% women’s representation. We do not identify a clear pattern of more or less women’s representation across the four main statistical US regions (see also Figure 1).
Performance at credit unions with more or less women’s representation on boards can vary widely. Smaller credit unions, on average, have both more women’s representation and have worse performance across many measures of performance. However, small size, rather than women’s representation, drives smaller credit unions’ worse performance.
Further, while women are often reported to be more risk-averse in financial decision-making, our statistical analyses do not find credit unions with more women’s representation to exhibit characteristics consistent with reduced risk-taking. Instead, while performance is broadly comparable between credit unions with lower vs. higher women’s representation, we find credit unions with more women’s representation to have slightly higher loan delinquencies (implying more inclusive lending) and somewhat higher asset growth rates.
Minority Representation on Credit Union Boards
Regarding minority representation on boards, we estimate that with 5,006 minorities among the industry’s 36,543 directors, there were 1.0 minorities per board, accounting for 14% of boards, which is similar to the average for corporations in the Russell 3000 index (13%), but far below the share of minorities in the communities that credit unions serve (42%). Most credit unions (2,991, or 60% of them), holding a large fraction of assets (39%), have no minority representation. A large fraction of credit unions (1,139, or 27% with 52% of assets) has between 0% and 40% minority representation. A small fraction (340, or 7% with 7% of assets) has boards with between 40% and 60% minority representation. Another small fraction (359, or 7% with 3% of assets) has boards with more than 60% minority representation.
In 2021, minority representation was not clearly associated with asset size, with similar (somewhat lower) average levels of minority representation for credit unions with between $10M and $10B (about 13%) and substantially higher average levels for credit unions smaller than $10M (21%) and larger than $10B (17%). During 2012–2021, minority representation grew modestly from 13.3% to 13.9% on an unweighted basis and from 12.6% to 14.2% on an asset-weighted basis, in either case far below the increase in the minority share in the US population, which grew from 37% to 42% over the same time period.
Performance at credit unions with more or less minority representation on boards can also vary widely. For instance, very small credit unions, on average, have both more minority representation and have worse performance across many measures of performance. However, small size, rather than minority representation, drives very small credit unions’ worse performance.
While performance is broadly comparable in credit unions with lower vs. higher minority representation, we found strong evidence that credit unions with more minority representation in their boards have substantially more inclusive lending, i.e., loan delinquency rates were higher without negatively affecting financial sustainability measures such as loan yields, ROA, capital ratios, or asset growth. Moreover, we found that credit unions’ lending inclusiveness was driven more by minority representation on boards (a purposeful decision) than by the share of minorities in the community (the characteristics of its borrowing pool).
We also explored the extent to which boards were representative of their communities across race and ethnicity in 2021. To assess minority underrepresentation, we compare minority representation on boards (which averaged 14%) and minority shares in the population of the counties in which each credit union operates branches (42%). Thus, minorities were underrepresented on boards, on average, by 28%.
The degree of underrepresentation varied widely. A small fraction of credit unions (290, or 6% with 7% of assets) have extreme underrepresentation (minority representation on boards fell short of the minority share of their communities by more than 50%). A sizable fraction (1,135, or 23% with 37% of assets) have critical underrepresentation (minority representation on boards fell short by between 30% and 50%). About half (2,255, or 46% with 44% of assets) had moderate underrepresentation (minority representation on boards fell short by between 10% and 30%). Another sizable fraction (1,054, or 21% with 10% of assets) are close to parity representation (minority representation on boards was within 10% of the minority share of their communities, either above or below). Another small fraction (213, or 4% with 2% of assets) have minority representation on boards that exceeds the minority share of their communities by more than 10%.
Impact on Performance
Generally, we find that, with the few exceptions that we highlight above, variation in board size, women’s representation, and minority representation has few measurable impacts across most of the key measures of performance that we explored. However, our findings do not imply that board size and composition do not matter. Our research focused on measures of performance for which data were widely available, such as how interest rates on loans and deposits compare with those of banks, loans per assets, loan delinquency ratios, product breadth, growth, return on assets, and capital ratios. These measures are of key importance, describing how well a credit union serves members today and how well it can be expected to do so in the future.
These metrics, however, do not provide a complete picture of a credit union’s overall performance. Board size and structure could, for instance, affect the satisfaction that a credit union provides to its members, employees, and broader community in ways that are important but that our measures do not capture.
Key objectives for which system-wide data are not available and that our measures of performance do not capture include, among others:
- The distribution of a credit union’s loans across income levels, credit score ranges, gender, or races and ethnicities;
- Credit unions’ focus on women-owned and minority-owned business lending; and
- Members’ feeling that their board, credit union, management, and employees are responsive to their concerns and that they represent them.
Key Takeaways
Ultimately, credit unions should choose board sizes and structures to optimize the internal working of their boards, and ensure open and effective communication between the membership and the credit union. To address these concerns, credit unions could, for instance, seek to ensure that their boards, management, and employees are both professionally qualified and broadly representative of their memberships across a wide variety of demographic variables including, for instance, gender, race and ethnicity, age, and income levels.
The link between board diversity and credit inclusion highlights that more credit-inclusive policies may help credit unions better meet both their social and financial goals. Inclusive credit policies better serve the credit needs of the whole community, focusing less on borrowers with stronger credit and more on those with weaker credit. Risk-based loan pricing (charging higher interest rates to borrowers with weaker credit) helps credit unions lend more to members who would otherwise be denied credit or be charged far higher interest rates elsewhere.
Risk-based, inclusive credit policies can simultaneously (1) help extend more credit to borrowers with weaker credit at rates lower than they would pay elsewhere; (2) fund abundant reserves to cover future loan losses; and (3) yield more revenues with which credit unions may finance more products and services for their broader memberships, including members with stronger credit.
These risk-based, inclusive credit policies (1) are financially sustainable, not negatively impacting loan yields, asset growth, ROA or capital ratios; (2) help credit unions better serve the credit needs of their whole communities; and (3) help credit unions provide more and better services to their broader memberships.
Co-author: Moriah Taylor


