
Gaining experience with big data helps credit unions get to the right solution

For many credit unions, it is difficult to find the answers to purchasing the right analytics solution, especially when you don’t know what questions to ask. Many have found success in starting small and getting their hands-dirty with data. It’s this hands-on experience that helps many CUs gain the experience to know what they want – and get it.
For many credit unions, the decision to begin using BA/BI is a big, complicated and expensive decision. Many do not have the expertise in-house to manage a project of this scope and end up relying on an outside resource to fill in the gaps in their knowledge. Without tangible hands-on experience, it is difficult for the leadership team at these institutions to understand the long-term implications of their decisions.
Determining the credit union’s goals for this new analytics capability is one of the most important decisions a president will have to make in this process. It’s ironic that the most important decision comes at a point when the organization’s leadership is least prepared for it. Yogi Berra once said; “If you don’t know where you are going, you’ll end up someplace else.” This seems an appropriate statement for a lot of credit unions that decide to dive into purchasing an analytics function. Without the experience, they basically delegate to their vendor the job of determining their goals and the appropriate level of budget and personnel commitment – only to find out later they bought the wrong product.
Many times it is not immediately apparent your CU has purchased the wrong analytic product. From start to finish implementing an analytics function is a long process. The right product not only collects, manages and analyzes your data it needs to provide the means to apply your new insights into actionable programs. This means your new stand-alone functionality needs to be integrated into the institution’s core decision making processes. To achieve this level of customization it’s critical to have hands-on experience guiding the process establishing your goals. This can save you a lot of pain later.
Hands-on experience helps your leadership team to begin learning what your member data can do, the resources required, the organizational implications, and to establish a realistic benchmark ROI. Having a better understanding of the impact of all these elements makes defining your analytics goals more in tune with the goals and resources of your institution.
So how do credit unions gain this hands-on experience? And how does this experience fit into a program to build an analytics program?
What if CUs were able to initiate a smaller member database, with core member data and select appended demographic data and have it securely hosted off-site? The characteristics of this “starter” analytics function would need to be:
- Flexibility to accommodate unforeseen future changes
- Robust enough so that they can provide real member insights. This increases the value of the hands-on experience – plus – some genuine marketing opportunities to bring to market.
- Easy to use analytics. This captures the enthusiasm of your team and puts the emphasis on data discovery and not on software.
- Ready to use with tools in place. Starter tools would need to include a segmentation scheme and a relative profitability measure.
Long-term, this initial database will provide your team the means to not only learn how data will impact what they know about members but to discover and implement select short-term marketing opportunities. As the team begins to see the limitations of this starter database it creates a series of discussions focused on the trade-off between the cost of expanding your capabilities and the potential incremental revenue. Each step in the evolution of your analytics function is measured and informed.
In general, for analytics, the growth in complexity is driven by the quantity and types of data to be collected/analyzed and the variety of applications for the resulting insights. The starter database is, for the most part, a “snapshot” of your members. Snapshot means it is your member data at a given point in time. There is no trending data. However, for CUs that have not seen their data analyzed before, this is a genuine eye-opener. Opportunities and threats can start to become defined and quantifiable. For example; single service households represent a CRM opportunity and threat of lost members due to the lack of depth in the relationship. Many teams are surprised to see that these households can represent 25% – 35% of total members.
Even this simple database can be tricky in terms of data definitions. Since most credit unions are focused on servicing their members – their member data is traditionally maintained at an account level only. To facilitate analytics even with a simple database it is important to structure the data into three levels: an account level, the member level, and the household level.
The end result of the snapshot is that leadership teams of many credit unions will begin to apply the insights from this simple database into their member strategies. Knowing the profiles of your most profitable members, their gateway products, and subsequent product/services provides insights to better construct new member onboarding and CRM programs.
But most importantly, this initial step provides a framework for the leadership team to begin working more effectively together. The common language around segmentation, member profitability, and product predictability help the team see the opportunities and the limitations of this initial data analytics configuration. As the team begins to reach the limits of this initial step there begins a process that looks at the trade-off between increasing the expense and personal commitment to move to the next step and the potential payoff of this increased commitments.
One additional data element that a number of CUs choose to add to their snapshot is non-member information. Once a branch footprint has been established (by plotting the address of members around each of the branches) you can purchase all the non-members in the designated market areas. These non-member names and addresses have the same appended data as members. Non-member data can provide insight into market share for individual branches, market share by segment and the potential for new member acquisition campaigns.
So where do we go from here?
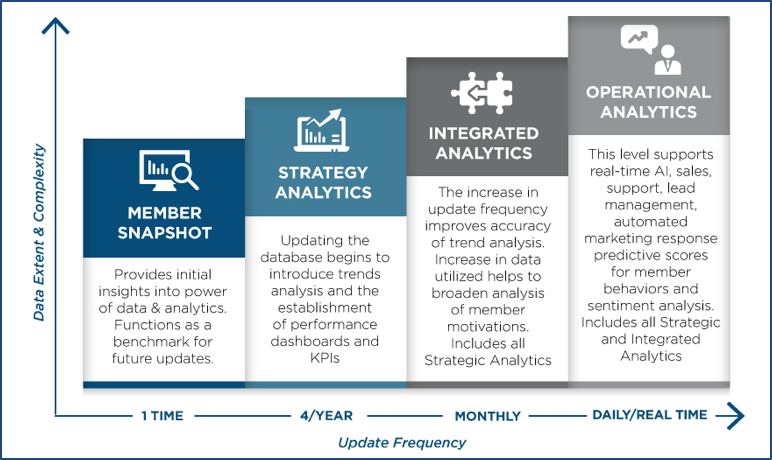
Given this starting point, we can begin to create several “levels” of analytic complexity. The complexity is driven by the frequency of the data being updated, the amount of data to be included in the database and uses the data. The schematic below illustrates roughly four configurations of data analytics – from less to more complex, starting with the member snapshot.
These configurations or bundles of capabilities are milestones along the path a credit union might follow as the organization evolves its analytics capabilities. Since every CU is different, and the purpose of this exercise is to create a customized analytics solution these three levels (after the snapshot) are never exactly the same for any two member institutions.
One thing to keep in mind is that not all credit unions will evolve their analytics to the level of Operational Analytics. As we said earlier, as CUs reach the limitations of their level, continued expansion is predicated on an ROI analysis (required budget and personnel matched to the projected incremental revenue – ability to hit benchmark ROI) of the next level.
Analytics Levels/Milestones for Evolving CU Analytic Capabilities
Moving from the Member Snapshot to the Strategy Analytics; the analytics capabilities are expanded by the following changes:
- The member file is updated on a quarterly basis. The most important dimension this level introduces is that of time. By updating the member file on a quarterly basis, member behaviors can be captured, quantified and attributed to CU specific promotions or external market factors. Updating quarterly provides insights into trends but it does have limitations when it comes to providing operational support for the CUs ongoing marketing and sales efforts.
- The member data from the CU is expanded. At this level, many credit unions choose to integrate all their member files – even those from non-CU subsidiaries. This expansion might include; non-core products/services like wealth management and insurance, more in-depth transaction data (expanded to include types not just quantity). Many CUs over the last few years, in order to offer greater value to their members, have purchased a broker/dealer or insurance brokerages to cross-sell into their member base. Integrating these member files provides a rich environment to develop predictive measures by product/segment, providing the tool for targeted cross-sell efforts.
- Campaign histories and results data are added into the database. Trends for selected member behaviors can be established and attributed to campaigns run by the CU or by external market factors and the impact quantified. By structuring campaigns with “source codes” or by appending a promotional history code when a member is contacted, management can begin to make decisions on the effectiveness of specific campaign elements.
Updating the database quarterly provides the basis for creating performance based measures or KPIs. Any member behavior can be tracked over time and goals established for member facing departments of the CU. For example, goals can be established for segment/product cross-sell benchmarks or any other desired member behaviors. For many CUs the Strategic Analytics level is more than adequate to drive strategic and tactical decision making. This decision can always be revisited if the needs of the credit union change.
As we move from Strategic to Integrated Analytics the customization to individual CU requirements increases. This level of analytics complexity is primarily the result of increasing the update frequency from quarterly to monthly. This increase provides more clarity to trend analytics, an increase in member behavior data captured and more integration into marketing and sales operations. In addition, this update frequency matches the CUs financial reporting periods, which further integrates this analytics level into the existing reporting structure of the credit union.
This increase in frequency provides a broader application/utility for the data captured and analytics generated. This integration into the marketing and sales operations of the CU requires a significant commitment of budget and personnel resources. Marketing operations include the establishment of an automated marketing platform for the distribution of inquiry follow-up letters and behavior triggered, targeted promotions.
Moving to Operational Analytics, this final stage is fully integrated into marketing, sales, member servicing, digital marketing, and social media platforms. This integration drives real time changes to messaging by member by channel. Artificial intelligence begins to play a role in the logic for managing messaging based on member behaviors across multiple channels. Being part of the operations of the CU’s member facing platforms, this stage collects and reacts to behaviors in real-time.
After going through the evolution of analytics functionality it’s clear to see the difficulty in predicting all the possible outcomes of installing an Operational Analytics level package into the credit union. These packages have links into almost all departments, create new roles and responsibilities for many in the leadership team, require a shift in culture to be more collaborative and data driven; make it critical that all stakeholders understand their new mission. Sometimes significant changes like these need more time and education for stakeholders; in order to make the changes permanent.