
No, the title of the article isn’t incorrect; we’re going to be talking about using Fed funds futures to gain perspective on where the market believe rates are heading. But first, some background.
The future direction of Fed funds futures is important for several reasons. The funds target rate has been the primary tool the Fed uses to attempt to keep the economy on an even keel since Chairman Paul Volcker introduced the technique in 1979, ushering in the monetarist era at the Fed. (Prior to that, the Fed had primarily used the money supply to govern the economy. However, the definition of “money” has become less concrete than it was prior to 1979, thus Volcker turned to the funds target.)
The Fed funds rate is the rate at which large banks borrow and lend excess reserves among one another, depending on whether they hold excess reserves or have a deficit. The funds target, set by the Fed, provides a basis for that interbank borrowing rate; the actual rate at which the borrowing takes place is the Fed funds effective rate, but it typically varies from the target rate by only a nominal amount.
Here's how the Fed uses the funds target to influence the economy: when economic activity heats up, bringing with it the threat of higher inflation, the Fed (through the Federal Open Market Committee, or FOMC) increases the funds target, tightening monetary policy. Conversely, when economic activity slows to the point that a recession may occur, the FOMC eases policy, reducing the funds target in an effort to make borrowing cheaper and thereby stimulate the economy.
We use the term “attempts” because, since 1998, the Fed has more often than not gotten it wrong, holding rates too low for too long, resulting in a bubble, and not recognizing the signs of those bubbles until it’s too late, and thus not commencing easing early enough to stave off a recession.
Another reason the funds target is important is that it provides the basis for other rates that drive the economy in terms of lending and borrowing, from the prime rate (which is directly tied to the funds rate) to Treasury yields across the maturity spectrum. Since long-term rates reflect market expectations for future short-term rates, when the Fed is tightening (i.e., the funds target is rising), Treasury yields rise accordingly. The more the Fed is expected to tighten, the higher intermediate and long-term yields will rise.
Thus, market participants and financial institutions have a keen interest in trying to divine what the Fed will do in the future. The Fed has tried to aid in that by providing more transparency in signaling the likely future path of monetary policy – easing or tightening. However, those signals are less than reliable, as the Fed may not adhere to the signaled future path.
We can also turn to the “dot plot.” This is a graphical representation of the individual FOMC members’ forecasts for the Fed funds target at various points in the future. A recent sample of the dot plot is presented below:
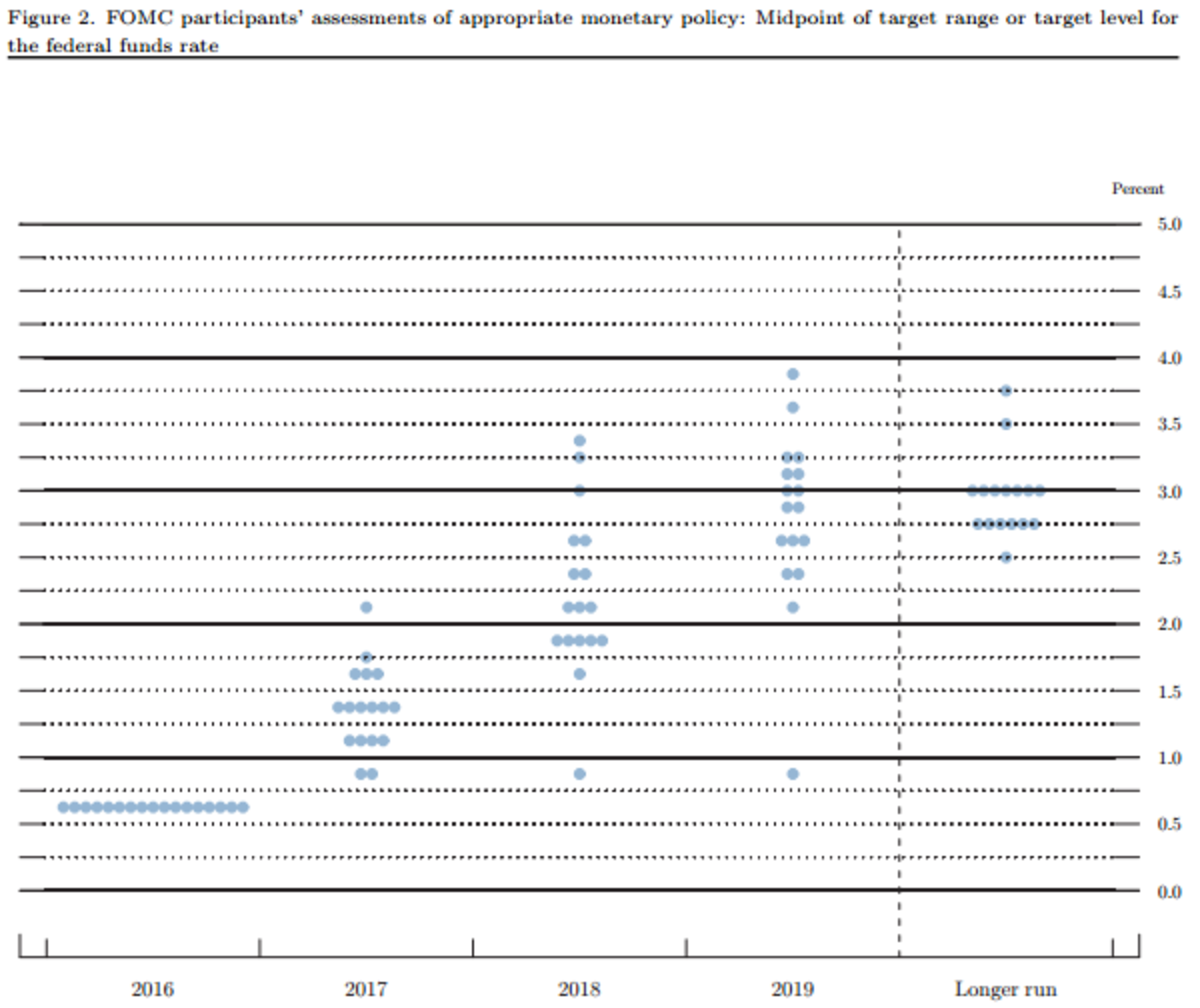
Source: Federal Reserve Board of Governors
The dot plot above – taken from the December FOMC meeting – indicates that, for 2017, FOMC members’ estimates of the funds target range from a low of 75-100 basis points (bp) to a high of 200-225 bp, with the median at 125-150 basis points. That median suggests a total of 75 bp of tightening from the current target of 50-75 bp. Since the Fed has traditionally raised the target by 25 bp at a time for the vast majority of instances in which it has tightened, that suggests three hikes in 2017, which is consistent with the Fed’s indicated forward guidance.
Note that the funds target has been presented as a range since the Fed cut the target to zero in 2008; however, the market typically looks at the upper bound of the range. Thus, the market views today’s funds target as 75 bp, and the median for 2017 as 150 bp. Either way, the dot plot indicates 75 bp of tightening.
And that presents one of the problems with the dot plot: it will always be consistent with the guidance indicated by the Fed in its efforts toward transparency. Thus, it doesn’t really provide any more meaningful information than the guidance, other than giving us a look at the dispersion among FOMC members.
The markets may disagree with the Fed’s guidance and the dot plot, based on its projections of future FOMC actions that are in turn based on forecasted economic activity. If the market believes that economic growth and inflation will be higher than the Fed forecasts, market participants will assume that the FOMC will have to be more aggressive than the guidance indicates.
So, to determine the market’s expectation, we can look at the Fed funds futures market. Fed funds futures are actively traded derivative instruments priced on the basis of market expectations of the funds target at various points in the future. The futures contract expiration dates are monthly, but some of the dates coincide with FOMC meeting dates, so they can provide an indication of the market’s forecast of the funds target following each FOMC meeting.
The formula for calculating the implied probability of a given Fed funds target rate based on the futures contract price at any point in time is as follows:
P’ = (FF’ – FF)/(FFf/FF)
Where:
P’ = Implied probability of Fed move
FF’ = Fed funds rate implied by futures contract price (100 – contract price in bp)
FF = current Fed funds target rate
FFf = Fed funds target assuming 25 bp hikes
Thus, if the current funds target (upper bound of the range) is 75 bp, and the current futures contract price for the end of 2017 is 98.5, the market has fully priced in the 75 bp of tightening that the Fed has indicated in its guidance and the dot plot (note that 100 minus the contract price in decimals is 150 bp):
P’ = (150 – 75)/(150 – 75)
= 1.00, or 100%
The implied probability is 100%, indicating that the market has fully priced in the three 25 bp hikes in 2017.
The Chicago Mercantile Exchange (CME), the exchange on which funds futures are traded, has provided an online tool to view a graphical representation of the implied probability at forward contract expiration dates that coincide with schedule FOMC meetings. The tool can be found at http://www.cmegroup.com/trading/interest-rates/countdown-to-fomc.html. Presented below are the CME’s graphs depicting the implied probability at March 15, 2017 (the date of the next FOMC meeting) and at December 13, 2017 (the date of the last FOMC meeting of the year):
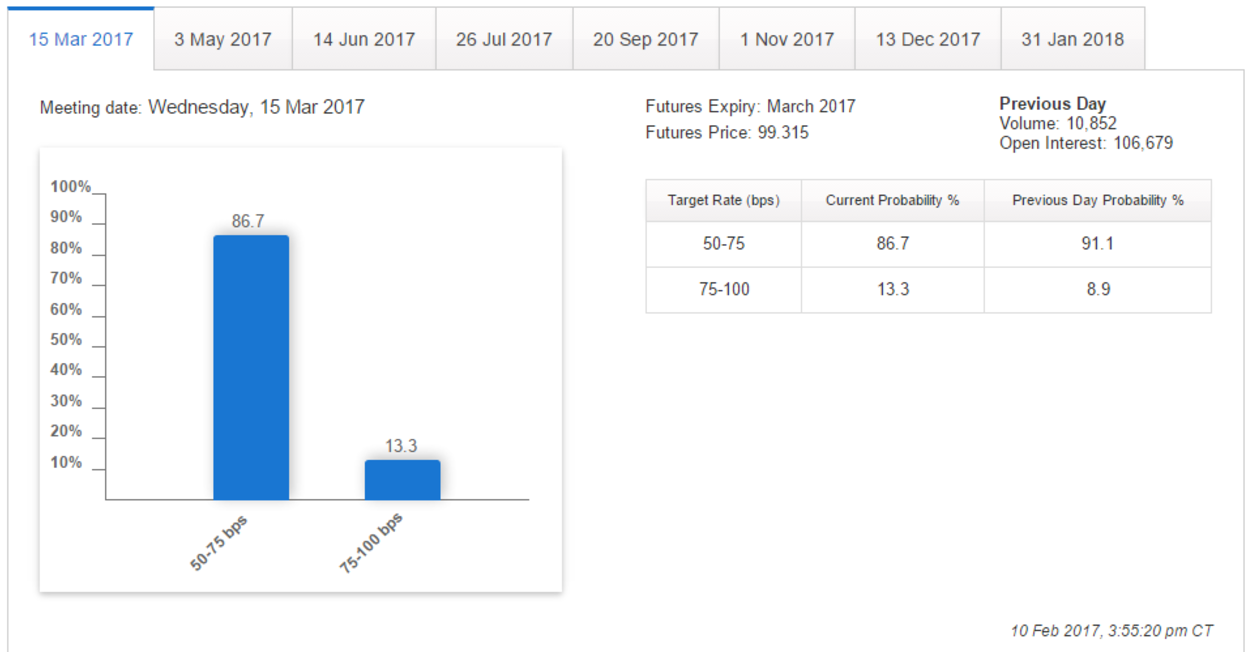
Source: CME Group
Thus the market has priced in an 86.7% chance of no rate hike at the March meeting, and only a 13.3% chance of a 25 bp hike. For December:
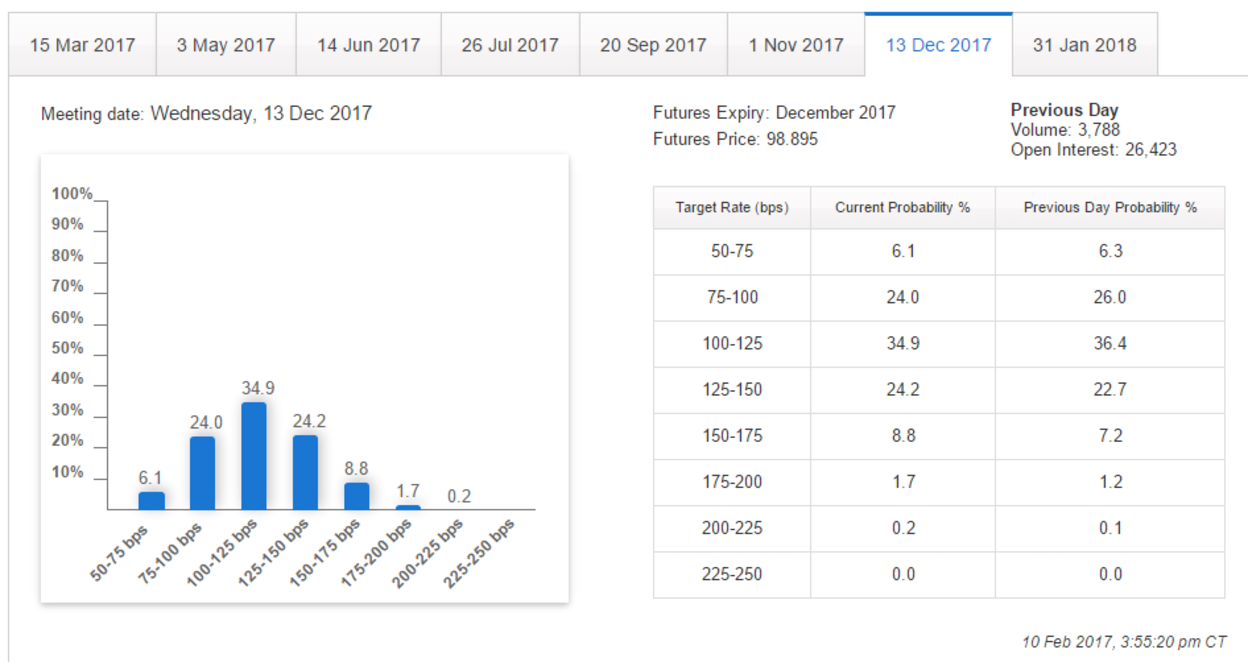
Source: CME Group
By the end of the year, the market has priced in a 34.9% chance of a total of 50 bp of rate hikes, thus the market has discounted the Fed’s projection of three 25 bp hikes and expects only two. The implied probability of the Fed holding to its guidance and hiking three times, for a total of 75 bp, is 24.2%.
These implied probabilities provide a view of market expectations of future FOMC actions that can be more powerful than the Fed’s stated guidance and the dot plot. Remember that the Treasury markets also trade on the basis of market expectations, so the actual pricing of Treasury yields – and thus everything from agency note yields to mortgage rates – are driven by the market’s expectations, not the Fed’s. However, we should also note that traders are not infallible – if they were, we’d all be traders.