
As professional portfolio managers, we are rarely surprised by actual portfolio performance when returns are posted. We should always have a good idea of our portfolio’s estimated sensitivity to changes in macro factor risks – level of rates, curve slope, asset spreads, rate volatility, and prepayments. As those risks change, we expect the market value of our portfolio to change accordingly, assuming reasonable modeling assumptions.
More importantly, depository portfolios should be built to complement overall balance sheet risk, having nothing to do with opinions on the future path of interest rates. The latter was a source of folly for the failed Silicon Valley Bank (SVB). In his written testimony before the Senate banking committee on May 16, former SVB CEO Greg Becker made a curious statement in defense of the bank’s risk positioning. “Importantly, throughout 2020 until late 2021, the messaging from the Federal Reserve was that interest rates would remain low and that the inflation that was starting to bubble up would only be ‘transitory,’” said Becker. As any veteran capital markets or banking professional understands, “because the Fed said so” is not a viable defense for poor discipline and risk management.
Surprising portfolio risk positions
In reviewing several portfolios and industry call report data in the wake of the March bank failures, we have been surprised to see the risks taken by some depository portfolio managers. We found portfolios with concentrated fixed-rate bond allocations and portfolio effective durations well north of 5%. Rarely did we find allocations to floating-rate securities, which, in addition to providing an interest-rate risk offset to the longer fixed-rate positions, are also one of the only sectors in the high credit quality fixed income space with a negative correlation when analyzing historical returns. We have also not found these portfolios to utilize interest rate swaps or other derivatives to reduce overall portfolio duration.
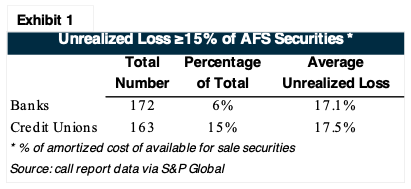
In Exhibit 1, we show Q1 call report data for banks and credit unions with total assets between $250 million and $50 billion, and we then evaluated unrealized losses on available for sale (AFS) bond portfolios as a percentage of the total portfolio. For banks, there were 172 institutions, or 6% of the total, with unrealized losses of 15% or more of the total portfolio. For credit unions, there were 163 such institutions, which accounted for a larger 15% share of the credit union list. Given the change in Treasury yields since the end of 2020, this would imply portfolio effective durations of more than 5% for these institutions. Was this interest-rate risk profile intentional?
In our experience as asset liability management (ALM) consultants and fixed income portfolio managers, the typical depository portfolio effective duration is 3% or less (unhedged), unless there are special circumstances related to a specific institution’s funding and asset mix. Some of the institutions represented in Exhibit 1 could fall into this category, and as such, a longer portfolio duration was no accident. However, in reviewing the asset mix of other portfolios in recent weeks, we wonder if those investors truly understood the risk profile of the underlying assets, particularly those assets with embedded options.
Popular trades came with significant convexity risk
For example, a popular trade recommended by some broker dealers amid a period of lower rates and faster mortgage prepayments was to buy longer, 10-15 year callable agencies at par dollar prices as an alternative to Agency MBS with similar coupons at premium dollar prices. At the time, even the lowest coupon MBS pools were trading at premium dollar prices, and some believed these securities were a way to avoid premium risk and achieve a more stable yield over the life of the asset, particularly amid a heavy refinance wave at the time. We saw a similar trade in the Agency CMO market, where many depository investors would purchase bonds with reduced (stripped down) coupons off 30-year collateral at prices close to par. While both trades offered “stable yields,” both also came with significant convexity risk. That is, the interest-rate risk profile of those securities could (and did) change significantly amid a shift in market interest rates.
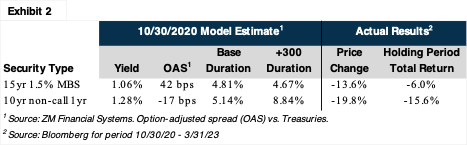
In Exhibit 2, we compare a 10-year agency callable debenture after 1 year and a 15-year 1.5% MBS pool, both issued in October 2020. The callable bond presented a higher yield, with a similar base effective duration and no premium dollar price. However, that’s too simplistic of an analysis for two option-embedded assets with very different risk/payoff profiles. For a callable agency, the option exercise decision is binary – it’s either called in full or it’s not. For a mortgage, the option exercise is path dependent and non-binary, and even if prepayments slow to zero, there is still principal amortization on a monthly basis. Therefore, the 15-year MBS pool should experience less extension with rates higher, and the cost of the underlying options is typically lower. All of this becomes very apparent in an option-adjusted spread (OAS) framework, or at the very least, stressing the securities in varying rate environments.
Here's a simple way to think about convexity risk in option-embedded assets. When rates fall, principal cashflow increases at a time when reinvestment rates are lower, and when rates rise, the cashflows extend and must be funded for longer at higher rates. Both scenarios can be negative for earnings, particularly if not compensated properly for the underlying optionality. Of course, there is another scenario – rates sideways – where option-embedded assets perform well. That said, we must still choose the asset with the superior risk/return profile, while also being mindful of overall portfolio risk and diversification. Going back to the stripped-down coupon CMOs, an investor conceded risk-adjusted spread relative to the underlying collateral (30-year MBS) for the same amount of extension and less income to help buffer the impact of higher rates.
Building a sound investment portfolio framework
Portfolio management decisions, such as these, are likely contributors to the large number of credit unions and banks dealing with outsized unrealized loss positions. For investment grade fixed income, long-run outperformance versus a benchmark is achieved via 1) risk management (duration targeting), 2) sector allocation, 3) security selection, and 4) trade execution. The benchmark for a depository institution can simply be its cost of funds, or some other proxy for its liability (e.g., SOFR or Treasuries). For many of the institutions with outsized unrealized losses in Exhibit 1, we presume that the second tenet – sector allocation decisions – was a primary culprit. In other words, how you put the pieces together is just as important as the pieces themselves. Portfolios shouldn’t experience wild swings in effective duration if properly built and rebalanced.
Ultimately, poor risk management, whether in the bond portfolio or the balance sheet as a whole, can lead to unstable long-run earnings and capital erosion. For institutions like Silicon Valley Bank, it led to insolvency. Depository balance sheet and investment strategies should never be based on an opinion on future interest rates, expressed as mismatch between asset and liability risk. If the latter cannot be managed organically, interest rate derivatives may be utilized in a dynamic manner.