
In my previous article I explored the U.S. economy’s underlying strength—and provided readers with “Schenk’s Dismal Dashboard of Doom”—a handy (invaluable?) list of key performance indicators that can be used to both track and gauge economic developments over time.
The good news is that a majority of those dashboard metrics continue to reflect the idea that a recession is not very likely in the near future.
In addition, recent government data releases show that U.S. economic fundamentals remained solid over the past several months.
Consider the following recent developments:
- Labor markets still reflect generally healthy conditions. The US unemployment rate at this writing is 4.3%. That’s only a tenth of a percentage point higher than the year-ago reading. It’s also well below the 5.7% post-WWII average unemployment rate and close to the midpoint of the 4.1% to 4.7% range considered to be “full employment” by many economists.
- Worker incomes continue to rise faster than the inflation rate. In fact, average weekly earnings increased by 3.4% in the year ending August 2025—while prices rose 2.9% over that same period.
- Against this backdrop, consumer spending has been strong, pushing second-quarter economic growth up to a revised 3.8% annualized rate. That’s nearly one full percentage point above the post WWII average rate of growth in economic output.
- Earnings among S&P 500 companies are on track for a 7.9% year-over-year increase—which would be the ninth consecutive quarter of earnings growth for firms in the index.
On the other hand, there are important reasons for concern. For example:
- While labor markets seem healthy, not all workers are on the same path. The unemployment rate among Blacks/African Americans recently rose to 7.5%—it’s highest reading in four years and more than three full percentage points higher than the average rate for all workers.
- Consumer spending HAS boosted economic growth—but imports (a subtraction from GDP) also played a role.1 In addition, it’s important to note that consumer spending has been lumpy—with Moody’s Analytics reporting that the highest 10% of wage earners are accounting for nearly half of all consumption today. That percentage is a modern-day high and a big jump from the 1992 cyclical low of roughly 35%.
- Lower-income consumers reflect more caution, and their confidence (hence purchasing activity) has been shaky. A recent analysis in Bloomberg’s Odd Lots Newsletter looks at Morning Consult’s Daily Consumer Sentiment Index—adjusted for income level. It finds that lower- and middle-income consumer sentiment has moved sideways (at relatively low levels) over the past four months. In contrast, sentiment among wealthy consumers (income >$100K) has closely tracked the booming stock market over the same period.
- One more thing to consider: While six of the nine dashboard metrics presented in my previous article continue to reflect overall benign trends, one very important metric is now flashing recession. The Conference Board’s Leading Economic Indicators—consisting of 10 metrics (3 financial components and 7 non-financial components)—reflects widespread weakness and a negative growth rate over the past six months—which triggered a recession signal in August.
Given the conflicting data, now might be a good time to more rigorously monitor your member’s financial wellbeing.
As a starting point be sure to visit the National Credit Union Foundation’s website2, where you will find a wide range of resources and ideas—including a “Quick Start Guide” published in partnership with the Filene Research Institute.
Be sure to also check out Filene’s recently-launched Center for Member Well-Being. Led by Filene Fellow, Mathieu Despard, The Center for Member Well-Being goes beyond “financial well-being” and brings a holistic approach to credit union efforts.
Finally, adequately monitoring your member’s financial well-being requires measurement. There are, of course, a wide variety of approaches to that work. But one that I find particularly compelling is the Federal Reserve Bank of New York’s Credit Insecurity Index.
It’s elegant, easy to understand, easy to calculate (you can easily get the data), and widely recognized as a reliable measure of consumer financial resilience—through the lens of access to credit.
In contrast to well-known and widely used approaches that focus on the existence of emergency savings balances, the New York Fed’s approach acknowledges that credit is a tool to tap future resources for use today so can be used as a similar—but arguably more powerful—substitute for savings balances. Fed researchers note—“used prudently, credit supports wealth-building, enhances financial security, and provides a buffer for unforeseen emergencies. Given the widespread use of financial data in modern economic life, credit behaviors also affect access to broader economic opportunities.”
Credit unions don’t have a line of sight into members’ savings with other providers so gauging health with an emergency savings metric is a real challenge.
In contrast credit reporting systems provide a much broader view into each consumer’s overall “portfolio”—both at the credit union and elsewhere.
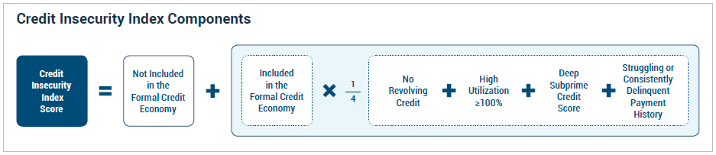
As shown in the figure below (copied from the New York Fed’s website) you can see there are basically five components to the index—and it can be used to measure an individual’s “credit insecurity” (or, conversely, credit security) and—by extension—to measure your membership’s level of credit insecurity (or, conversely, credit security) as well.
A good way to evaluate the New York Fed’s tool is to look at the original report—Unequal Access to Credit: The Hidden Impact of Credit Constraints and to review a more recent update—Credit Insecurity in the United States: 2018-2023.
In addition, a webinar on the index is available at this link.
Changing economic conditions can dramatically change your members’ financial well-being. You should know when that happens. After all, your credit union’s biggest opportunities are almost always found where consumer needs are greatest.
[1] Importers sought to side-step tariffs by front-loading purchases in the first quarter then bought less in the second quarter (when tariffs were in place).
[2] https://www.ncuf.coop/financial-well-being-for-all/