
Data is one of the most powerful tools automotive lenders can use to inform their decision making. It can provide insight on a macro-, micro-, national, and regional level—something that can make a big difference when it comes to strategy. As the automotive industry continues to evolve following a turbulent year, leveraging data and analyzing trends is even more important for auto lenders to continue to assess their opportunities, weaknesses and re-evaluate their strategies.
A consistent trend over the past year was the increase in total market share for captives. According to Experian’s Q1 2021 State of the Automotive Finance Market report, captives saw an increase from 23.82% in Q1 2020 to 28.02% in Q1 2021. The same was true looking at both the new and used financing markets, respectively. Captives increased their new financing market share from 50.36% to 53.40%, and their used financing market share from 7.70% to 9.12%. Other lenders, including credit unions, did not have the same experience.
Credit unions held 17.23% of the total financing market in Q1 2021, a decrease from 18.41% in 2020. The data told a similar story for new and used financing. Their new financing market share decreased from 11.19% in Q1 2020 to 10.05% in Q1 2021, and their used financing market share decreased slightly from 23.82% to 23.74% during the same time period.
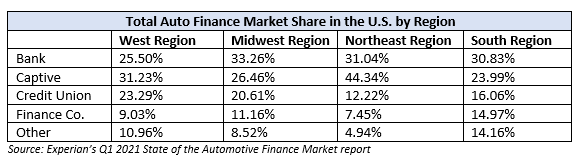
Credit Unions Hold Larger Portion of Market Share in the West and Midwest
While credit unions may be discouraged by these numbers, focusing in on a regional level paints a more positive picture. Looking at the total auto finance market, credit unions hold 23.29% market share in the West, and 20.61% in the Midwest. They hold a little less in both the Northeast (12.22%) and South (16.06%).
Opportunity in the Used Vehicle Market
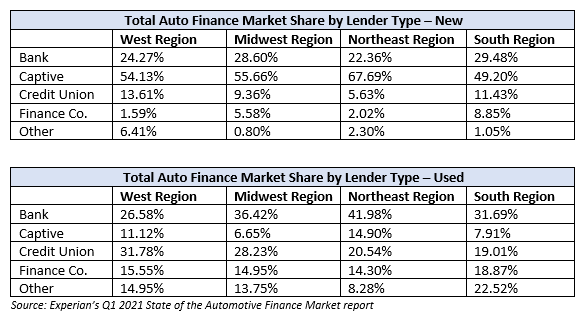
In addition to fluctuations across the total market, there were notable differences when breaking it down by new and used financing market by region, highlighting opportunity for credit unions particularly in the used financing space. Captives held the most market share for new vehicles across the board, making up over half of the market share in three out of four regions, followed by banks who held the second-most market share.
But while prime consumers have begun to shift back into new vehicles, there is still opportunity for credit unions to regain market share by focusing on the used vehicle market; a market where they hold more market share. Credit unions held the second-highest market share in the Midwest (28.23%) and Northeast (20.54%). Additionally, they held 19.01% used vehicle market share in the South, and surpassed banks in the West, holding 31.78% market share. Leveraging data at a regional level will help credit unions identify where they are most successful, and where they have opportunities for growth as they move through the second half of the year.
Most Financed Used Vehicles Per Region
As credit unions look to the used vehicle market for opportunity, keeping tabs on the most financed used vehicles on a regional level can help credit unions anticipate the needs of their consumers ahead of time. For example, the Ford F150 was the most financed vehicle in the West (3.00%), Midwest (4.08%) and South (3.78%), while the Toyota RAV-4 came out on top in the Northeast (2.52%).
As credit unions aim to grow their market share, leveraging current data and trends is crucial for building an informed strategy. While it is important to understand the data on a national level, it may not necessarily tell the whole story. Analyzing the data on a regional level, however, can give credit unions a clearer picture of where they are successful, where they can make improvements, and where untapped opportunity may exist.