As the summer season peaks, a depletion of surplus cash in hand is translating to slight increase in spending on consumer credit. At the same time, debit volume is lower compared with a year ago.
Steady job growth continued in July, as employers added 187,000 jobs, and unemployment declined to 3.5%. The health care, social assistance, wholesale trade and financial sectors were the top job gainers for the month.
Inflation ticked up slightly in July, to 3.2% over the prior year, with core CPI up by 4.7% over July 2022. Both figures were lower than consensus forecasts.
In response to moderating inflation and a still-tight labor market, The Conference Board’s Consumer Confidence Index rose for the second consecutive month in July to 117.0, representing the highest level of household confidence in two years.
After pausing in June, the Federal Reserve restarted its post-pandemic rate hike campaign,increasing the benchmark Fed Funds rate by 25 basis points at its July 26 meeting.
Overall, Co-op credit union spending data shows that June year over year transaction volume rose by 4.6% in credit while falling by -4.5% in debit.
Co-op’s SmartGrowth team members are closely watching the following key spending trends this month:
1. Online Discount Days Make Impact: Among the biggest headlines in July was Amazon’s record-breaking Prime Day, which saw shoppers worldwide purchase over 375 million items on the first day of the sale, a notable jump from 2022’s 300 million items sold.
According to Adobe Analytics, the event held July 12 and 13 drove U.S. online sales up by 6.1%for the 48-hour period. Not to be outdone, Amazon’s biggest retail competitor scheduled its “Walmart Plus Week” to coincide with Prime Day. Target and Best Buy held their own July sales events, as well.
According to Co-op’s credit union payment data for July, these special online sales events helped drive transaction volume in the Amazon/Bookstores merchant category up by 30.4% in credit and 60.6% in debit year over year.
2. Barbenheimer and Taylor Swift Tantalize: It seems that “tentpole movies” are back. Blockbusters took a massive hit during the pandemic, as theaters were shuttered and the practice of releasing films simultaneously on the big screen and on streaming platforms became commonplace.
But that all changed this summer, as the “Barbenheimer” phenomenon took hold with support from ubiquitous social media memes, a massive advertising push and generally positive reviews for both the “Barbie” and “Oppenheimer” films, which opened simultaneously on July 21. The box office for both films – as of July 31, “Barbie” earned $351 million in North America, and “Oppenheimer” took in $174 million – helped boost the industry despite the ongoing writers and actors strikes.
Meanwhile, consumers have also returned to live concerts and events this season, as highlighted by the success of Taylor Swift’s “Eras” concert tour. The pop singer’s appearances have reportedly boosted local economies nationwide, with one research firm estimating that the tour may end up generating up to 5 billion in economic impact – higher than the GDP of many countries.
“American households have returned in force to live and in-person events this summer,” said John Patton, Co-op Senior Payments Advisor. “This is a positive sign that the consumer is feeling optimistic about the economy and their own personal financial position as we move into the fall.”
Per Co-op’s credit union data, transaction volume within the Movie Theaters merchant category was up 16.5% in credit, and 7.1% in debit year over year in July. Overall, the Dining & Entertainment category was up 5.7% in credit and down -2.8% in debit for the period.
3. Massive Jackpot Drives Lottery Spending: With the Powerball lottery jackpot climbing to $1 billion in mid-July, it’s no surprise that the Government Lottery Tickets merchant classification code showed a strong increase in transaction volume. Although a single winner in California selected the winning numbers on July 19, the category still jumped up by 22.4% in credit and 13.0% in debit from June. It’s important to note that don’t allow consumers to purchase lottery tickets on debit and/or credit cards.
4. Migration from Debit to Credit Intensifies: The year-long trend of consumers’ spending preferences shifting from debit to credit continued in July. Credit transaction volume rose 3.4% month over month versus June, while debit volumes declined by -3.4%.
“If you look at debit and credit transaction volumes overall, credit spending is on an upward trajectory while debit is headed down or basically flat,” said Beth Phillips, Director, Co-op Solutions. “Consumers’ spending habits are shifting from debit and toward credit, with the shift from debit to credit highlighted most when it comes to recurring monthly expenses such as utilities and subscriptions.”
“Some of the categories like Auto, Movies, Sports, Grocery suggest that consumers are lightly transitioning to credit due to the cash in hand is depleting finally,” said Patton. “It's not a big move but the data confirms more consumers are transitioning to credit from debit.”
According to Co-op credit union payment data, Subscription Services was down -2.8% in credit year over year in July, but down a larger -11.8% in debit for the same period. In Utilities, credit transaction volume was up 2.2% on credit, but down a significant -6.6% on debit.
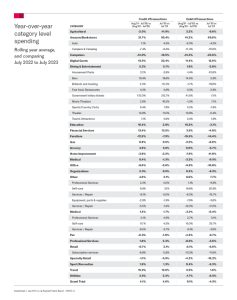
Year-Over-Year Category Level Spending (Rolling Year Average, and Comparing July 2022 to July 2023)
| Credit #Transactions | Debit #Transactions | ||||
| Category | (Aug'21 - Jul'22) vs (Aug'22 - Jul'23) | Jul'22 vs Jul'23 | (Aug'21 - Jul'22) vs (Aug'22 - Jul'23) | Jul'22 vs Jul'23 | |
| Agricultural | -2.5% | -11.9% | 2.2% | -9.6% | |
| Amazon/Bookstores | 21.7% | 30.4% | 41.2% | 60.6% | |
| Auto | 1.1% | 4.5% | -2.0% | -4.5% | |
| Campers & Camping | -7.4% | -8.4% | -11.4% | -16.6% | |
| Computers | -14.0% | -16.5% | -14.3% | -23.6% | |
| Digital Goods | 15.5% | 22.4% | 11.4% | 12.6% | |
| Dining & Entertainment | 5.2% | 5.7% | 1.6% | -2.8% | |
| Amusement Parks | 3.2% | -2.6% | -1.4% | -10.8% | |
| Bars | 19.4% | 16.6% | 14.5% | 5.6% | |
| Billiards and bowling | 2.0% | -10.3% | -1.7% | -16.8% | |
| Fast food, Restaurants | 4.3% | 4.8% | 0.3% | -3.9% | |
| Government lottery tickets | 133.0% | 212.7% | 41.5% | -7.1% | |
| Movie Theaters | 2.6% | 16.5% | -1.3% | 7.1% | |
| Sports/Country Clubs | 9.4% | 7.8% | 5.2% | -1.9% | |
| Theater | 15.8% | 11.0% | 10.9% | -0.4% | |
| Tourist Attractions | 7.1% | 5.6% | 2.4% | 1.9% | |
| Education | 16.4% | 2.8% | 16.2% | -3.1% | |
| Financial Services | 13.4% | 13.5% | 3.9% | -4.8% | |
| Furniture | -12.9% | -7.9% | -15.5% | -14.4% | |
| Gas | 0.8% | 0.5% | -2.5% | -8.0% | |
| Grocery | 4.9% | 5.6% | 0.0% | -5.7% | |
| Home Improvement | -3.8% | -3.2% | -7.6% | -11.8% | |
| Medical | 0.4% | -1.3% | -3.2% | -9.5% | |
| Office | -8.6% | -2.6% | -6.9% | -10.8% | |
| Organizations | 2.3% | 0.9% | 0.2% | -6.2% | |
| Other | 4.6% | 3.1% | 8.0% | 7.7% | |
| Professional Services | 2.3% | 4.0% | 1.1% | -9.9% | |
| Self-care | 8.9% | 3.1% | 16.8% | 20.6% | |
| Services / Repair | -8.1% | -5.0% | -8.3% | -13.7% | |
| Pet | -0.3% | -1.0% | -4.2% | -9.7% | |
| Professional Services | 1.8% | 2.3% | -0.6% | -3.6% | |
| Retail | -0.7% | 2.1% | -5.1% | -6.6% | |
| Subscription services | -6.8% | -2.8% | -13.2% | -11.8% | |
| Specialty Retail | -1.1% | -5.9% | -4.3% | -15.2% | |
| Sport/Recreation | 1.8% | 1.3% | 0.4% | -5.3% | |
| Travel | 19.2% | 12.6% | 6.9% | 1.6% | |
| Utilities | 3.5% | 2.2% | -1.7% | -6.5% | |
| Grand Total | 4.1% | 4.6% | 0.1% | -4.5% | |
What Credit Unions Should Do Now
As the days shorten and nights grow cooler, members’ minds are beginning to drift toward fall. And this means back-to-school, back to work and the start of early holiday shopping.
Credit unions should make sure to activate their loyalty rewards program and incent members to use their card within the most popular shopping categories this autumn, such as retail, education and business travel.
Credit unions should also be sure to provide their members with a full portfolio of convenient digital payment options to support them as they shop and spend online, and in the store. This portfolio should include such table-stakes offerings as the ability to deliver digital card credentials instantly through digital card issuance, as well as Zelle P2P, contactless cards, and digital wallet provisioning.
More information on the Co-op SmartGrowth Consulting Team can be found here.