RALEIGH, NC (November 11, 2013) -- According to data from Sageworks, a financial information company, smaller privately held companies are seeing a significant slowdown in their rate of sales growth. After two years of strong sales growth (around 7 percent), small U.S. companies are seeing the slowest rate of sales growth since the recession (less than 1 percent) so far this year. Note: 2013 numbers are year-to-date estimates. They are subject to change and revision.
- Sales growth for businesses with less than $5 million in annual sales is virtually non-existent so far in 2013 (companies are growing sales at a rate of less than 1 percent).
- Profit margins are healthy for now, but may be difficult to sustain if sales growth does not increase.
- This slowdown in the rate of sales growth does not bode well for small business hiring. Small businesses were reluctant to hire when they were growing sales at a rate of 7 percent.
- Smaller manufacturing, wholesale, and retail companies are seeing a sales contraction in 2013 to date.
All Small Businesses: U.S. Small Business Sales & Profitability , 2009-YTD 2013
Private Companies With Less Than $5 Million In Annual Sales
| Industry | Financial Metric | 2009 | 2010 | 2011 | 2012 | 2013 YTD |
| All Industries | Sales % Change | -5.2% | 5.2% | 7.4% | 7.5% | 0.3% |
| All Industries | Net Profit Margin | 3.1% | 4.0% | 4.5% | 6.8% | 10.3% |
| All Industries | Gross Profit Margin | 63.6% | 64.1% | 64.9% | 65.6% | 64.8% |
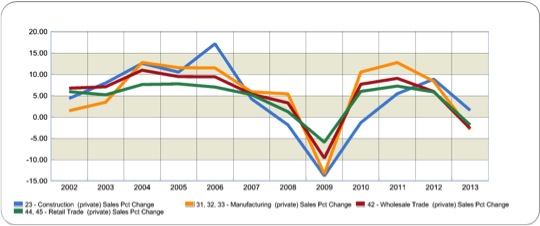
By Sector: Sales Growth, 2002-2013 YTD
By Sector: U.S. Small Business Sales & Profitability, 2009-YTD 2013
Private Companies With Less Than $5 Million In Annual Sales
| Industry | Financial Metric | 2009 | 2010 | 2011 | 2012 | 2013 YTD |
| 23 - Construction (private) | Sales % Change | -13.8% | -1.3% | 5.5% | 8.9% | 1.6% |
| Net Profit Margin | 0.4% | 0.6% | 1.5% | 3.7% | 6.7% | |
| Gross Profit Margin | 35.9% | 35.4% | 35.1% | 35.8% | 38.5% | |
| 31, 32, 33 - Manufacturing (private) | Sales % Change | -13.3% | 10.5% | 12.8% | 8.4% | -2.9% |
| Net Profit Margin | 0.5% | 2.1% | 2.9% | 4.2% | 6.3% | |
| Gross Profit Margin | 42.1% | 42.5% | 42.4% | 42.9% | 44.3% | |
| 42 - Wholesale Trade (private) | Sales % Change | -9.6% | 7.7% | 9.1% | 6.0% | -2.7% |
| Net Profit Margin | 1.9% | 2.9% | 3.0% | 4.0% | 5.1% | |
| Gross Profit Margin | 34.8% | 34.8% | 34.4% | 34.3% | 35.3% | |
| 44, 45 - Retail Trade (private) | Sales % Change | -5.9% | 6.0% | 7.2% | 5.9% | -1.9% |
| Net Profit Margin | 1.3% | 2.0% | 2.4% | 3.4% | 4.5% | |
| Gross Profit Margin | 35.4% | 34.8% | 34.6% | 34.6% | 35.6% |
About the Data
Sageworks possesses a proprietary database of privately held company financial statements aggregated by industry. Each day, approximately 1,000 of these financial statements are collected by Sageworks from accounting firms, banks, and credit unions through a cooperative data model with Sageworks’ clients. The data is segmented and can be queried by 1,400 industry codes, 70 financial metrics, company size, and geographic location.
About Sageworks
Raleigh, NC-based Sageworks is a financial information company. Sageworks’ data and applications are used by thousands of financial professionals across North America to analyze privately held companies.