Imagine you need to add a quart of oil to your car. You pop the hood and grab your funnel. As you start to pour, you realize the funnel has several holes in it—more than just the one it’s supposed to have—and oil spills everywhere. Some gets inside your engine, but most of the oil is dripping down the engine block and onto your garage floor.
As a credit union marketer, you likely spend quite a bit of time trying to drive more traffic to your website. You definitely need traffic, but alone it’s not enough. In order for your credit union to grow, your website needs to convert the traffic into new members, loans, and deposits.
The people visiting your website are the oil, your website is the funnel, and your credit union is the engine. Your website’s job is to get people into your credit union. But what if it has holes in it? Just as you don’t want most of the oil to spill, you don’t want to drive tons of traffic to your site and get only a few conversions.
When someone visits your website, you want them to take a desired action, like apply for an auto loan. But not everyone submits an application. A few people bounce without ever making it past your homepage. Others learn more about your products, then leave. And some go on to apply and become lifelong members. Obviously, we want the latter, but how do we get more people to apply?
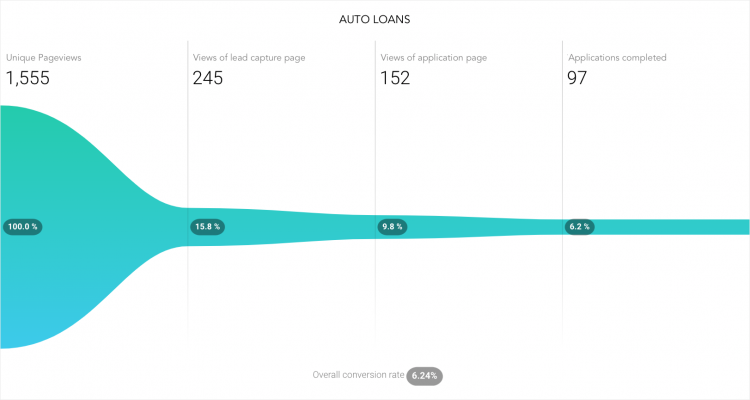
An example of funnel analytics for a credit union website.
Let’s look at your website like a funnel. Your goal is to move people from the beginning (most often your homepage) to the end (at which point a new loan or account is funded). The success of a funnel is measured by its conversion rate. To calculate an overall conversion rate, you divide the number at the end of the funnel by total website sessions.
Conversion Rate = Applications Funded / Sessions
Funnel analytics also show us conversion rates along the funnel and where there are bottlenecks. Wherever there is a bottleneck, there is an opportunity for improvement. And when an improvement is made, the bottleneck widens, more applications are funded, and your revenue increases.
The process of widening bottlenecks by increasing conversion rates is called Conversion Rate Optimization (CRO). If your website isn’t delivering the results you want, it’s time to invest some resources into CRO–focus on generating more conversions from existing traffic before trying to get more and more traffic. There is a step-by-step process you can follow to start seeing wins and grow your credit union.
The conversion rate optimization (CRO) process
Step 1: Analyze conversion funnels
The first step is to analyze your conversion funnels. A complete funnel starts with total website sessions and ends with the number of applications funded. But you may also want to create funnels for smaller subsections. And, you may want different funnels for all products, loans only, accounts only, individual products, etc, so you can see the performance of your website as a whole and also zero in on certain products.
See the tools we use to set up funnel analytics.
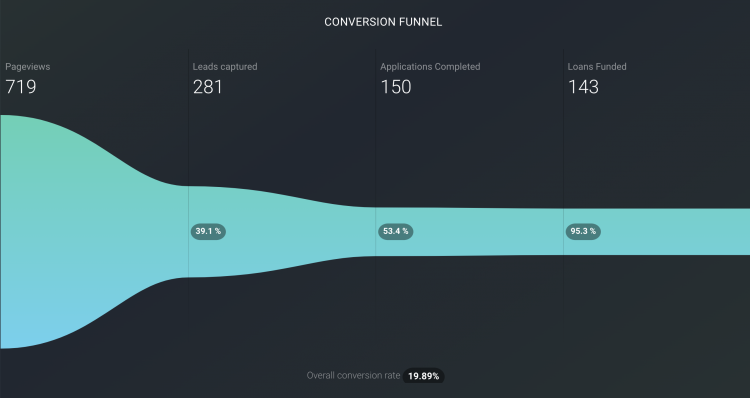
Another example of funnel analytics.
Step 2: Calculate current website revenue
Ultimately, you want to increase your revenue and CRO is a means to do that. So, next, calculate the revenue your website is currently generating to get a baseline for improvement. If your credit union has over $100M in assets, your site should be generating millions of dollars.
We built a handy Website Revenue Calculator to make it easy for you to quantify the revenue generated by your website.
Step 3: Investigate bottlenecks
Where is the smallest bottleneck in your funnel? Now it’s time to dig in and try to understand opportunities for improvement. There are many methods and tools that can help you with your research.
As you research a bottleneck, you’ll form a hypothesis about how to widen it and get more people through the funnel.
Step 4: Test your hypothesis
Design an experiment, such an A/B test or usability study, to prove your hypothesis true or false. Implement the experiment on your website and measure the results.
See the tools we use for A/B and usability testing.
Step 5: Project impact and implement your findings
After running a winning A/B test, you can project an increase in revenue by plugging a new conversion rate into the Website Revenue Calculator from Step 2. Now, implement your winning variation on the website.
Repeat these steps, over and over. And as your conversion rates rise, drive more traffic to your website.
The impact of CRO
CRO produces real results. Take a look at a few success stories we’ve seen with our own clients.
- We implemented personalization on HFSFCU’s website so returning visitors were shown content based on their previous browsing behavior (e.g., after visiting the auto loan page, the user is shown an auto loan promotion on their next visit). An A/B test with over 296,000 pageviews showed that personalization led to 213% more click-throughs.
- Voyage FCU’s membership application was a bit long. So, we designed a multi-step form that splits the application into two shorter steps and starts with lead capture. Additionally, we repeated the call to action more frequently on the membership page. We ran an A/B test and the new form generated 175% more leads and 35% more applications.
- We helped People Driven CU create a simpler lead capture form. When we A/B tested it, it generated 4x more leads.
Now it’s your turn. Dig into your website, follow this step-by-step process, and start generating more revenue.