Despite an improving economic outlook, U.S. consumers are holding tight to their wallets.
Nonfarm payrolls jumped by 339,000 jobs in May, yet the unemployment rate ticked up to 3.7% for the month, an increase over the 50-year low of 3.4% posted in April. Much of this discrepancy can be traced to differences between the Labor Department’s employment report and household survey. The household survey showed that employment actually showed a net decline of 310,000 jobs for the month, led by a significant drop in “unincorporated self-employed workers,” as well as a slight drop in average hours worked per week.
Inflation also showed signs of weakening, declining for the tenth straight month since reaching its peak of 9.1% in July 2022. The May rate was 4.9% on an annualized basis.
Despite these positive signs, The Conference Board reported a monthly decline in its Consumer Confidence Index in May to 102.3, down from 103.7 in April. This drop shows that consumers are still pessimistic about the overall state of the economy, future business conditions and current employment prospects.
The Federal Reserve raised its benchmark rate by another quarter point at its May meeting, but it has a tough task ahead in June in deciding whether to increase rates for the eleventh time over the past 15 months. It will need to balance a strong job market and stubborn inflation with a precarious banking climate and the recent news that the Eurozone has slipped into recession, led by high consumer prices and declining economic conditions in Germany and Ireland.
Overall, per Co-op Solutions spending data, May year over year transaction volume was up modestly across both the debit and credit portfolios.
The SmartGrowth team at Co-op Solutions is closely watching the following key spending trends this month:
1. Conferences lead travel revival
Travel has been among the most resilient categories in recent months, posting a 69.7% transaction growth in credit and 65.9% in debit year over year, per an analysis of Co-op’s credit union portfolio. Business travel – and the return of live conferences specifically – have been a boon to the category, a bright spot in the overall economy.
To Las Vegas, a city uniquely dependent upon business conferences and tourism, the return to pre-pandemic “normalcy” has been a welcome boost to the economy. Whereas unemployment in “Sin City” hit a historic rate of 34% in April 2020, it has since rebounded to a manageable 5.7% as of March 2023.
“The travel sector has been one of the best stories of the past year,” said John Patton, Co-op Senior Payments Advisor. “Leisure travel spending will continue to increase this summer, and when combined with the return of corporate travel and events, we expect the overall category to show strong growth through the remainder of 2023.”
2. Discount stores still holding strong
Although the broader retail category has suffered over the past year, discount stores remain a bright spot as consumers look for deals in their everyday spending to offset rising prices. According to Co-op’s credit union payment portfolio data, discount stores are up 2.3% in credit transaction volume and down -2.2% in debit year over year. Compare this with specialty retail, which is down by -8.8% and -10.3% in credit and debit respectively, over the same time period.
“Discounters like Target, which had flat sales in its latest quarter compared with prior year, are holding their own,” said Beth Phillips, Director of Strategic Portfolio Growth for Co-op. “Shoppers are going to continue to look for discounts on the brands they value, as they wait for inflation to finally cool off.”
3. Grocery spending increases as inflation eases
The gradual easing of inflation is finally helping consumers’ pocketbooks, as grocery prices ticked down by 0.2% in April. This decline is translating to increased monthly transaction volumes in the grocery category, which rose by 6.4% in credit and 5.5% in debit in May, respectively. Interestingly this lift is attributed in large part to wholesale grocery retailers, which outperformed grocery stores across both credit and debit. Of particular interest to credit unions, consumers who shop for groceries online are among the most desirable, spending 34% more per purchase as compared with in-person transactions.
4. Home improvement softening year over
Homeowners appear to be finally over their love affair with home renovation projects, one of the true economic bright spots during the pandemic. The category is down slightly year over year, with nearly double-digit declines in the appliances and repair services sub-categories.
“The seasonality of home improvement shouldn’t be overlooked,” said Phillips. “Credit unions should keep home improvement promotions in mind leading into summer to earn top interchange in this category.”
Concerned with this recent trend, Home Depot warns that its annual sales will decline this year, for the first time since 2009.
5. Pets feel the economic pinch
During this period of economic uncertainty and rising inflation, certain luxury purchases have been particularly impacted. This includes spending within the pet category, which has seen both supply shortages and a faster rise in prices than other merchant categories, such as groceries. Co-op’s analysis shows that year over year, transaction volumes within the pet category are down by -0.7% and -3.3% in credit and debit, respectively.
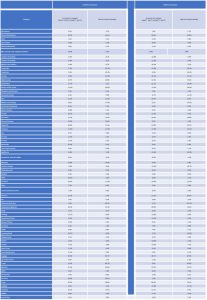
Year-Over-Year Category Level Spending (Rolling Year Average, and Comparing May 2022 to May 2023)
| Credit #Transactions | Debit #Transactions | |||||
| Category | 12-month YoY Analysis: May'21 - Apr'22 vs May'22 - Apr'23 |
May'22 vs May'23 Analysis | 12-month YoY Analysis: May'21 - Apr'22 vs May'22 - Apr'23 |
May'22 vs May'23 Analysis | ||
| Agricultural | 0.3% | -3.7% | 1.6% | 5.1% | ||
| Amazon/Bookstores | 19.7% | 33.1% | 29.9% | 67.6% | ||
| Auto | 3.5% | 3.1% | -3.5% | 3.8% | ||
| Auto Dealers | -0.6% | -2.3% | -8.9% | -4.0% | ||
| Auto Services/Parts | 2.6% | 2.7% | -3.7% | 4.3% | ||
| Misc. aircraft, farm equipment dealers | 10.4% | 6.1% | 0.0% | 2.9% | ||
| Campers & Camping | -4.9% | -6.1% | -12.8% | -5.9% | ||
| Campers & Camping | -4.0% | -6.1% | -11.9% | -5.9% | ||
| Mobile Home Dealers | -8.4% | -8.7% | -16.0% | -3.2% | ||
| Computers | -5.7% | -20.1% | -12.8% | -18.1% | ||
| Computers | 1.9% | -20.1% | -3.6% | -18.1% | ||
| Services | -9.9% | -32.8% | -16.2% | -27.1% | ||
| Digital Goods | 16.7% | 20.6% | 11.6% | 15.2% | ||
| Applications | 27.1% | 2.5% | 12.1% | -18.0% | ||
| Books, movies, music | -12.6% | -56.8% | -12.2% | -56.0% | ||
| Dining & Entertainment | 7.4% | 3.2% | 1.0% | 1.4% | ||
| Amusement Parks | 8.2% | -9.9% | -0.7% | -11.2% | ||
| Bars | 24.1% | 11.9% | 16.5% | 8.7% | ||
| Billiards and bowling | 8.9% | -17.8% | 0.1% | -22.6% | ||
| Fast food, Restaurants | 6.3% | 2.7% | -0.5% | 0.5% | ||
| Movie Theaters | 14.8% | 2.1% | 8.2% | -5.6% | ||
| Theater | 18.7% | 3.2% | 11.6% | 3.3% | ||
| Education | 17.7% | 13.3% | 15.9% | 18.8% | ||
| Financial Services | 15.8% | 13.6% | 4.3% | 1.8% | ||
| Payments | 40.8% | 27.4% | 31.8% | 29.7% | ||
| Furniture | -11.9% | -11.9% | -17.9% | -12.5% | ||
| Gas | 8.7% | -0.9% | -2.3% | -2.0% | ||
| Grocery | 11.3% | 5.1% | -0.5% | 1.6% | ||
| Grocery | 11.5% | 5.1% | -0.3% | 1.6% | ||
| Wholesale | 12.1% | 9.2% | 0.1% | 5.3% | ||
| Home Improvement | 0.4% | -0.4% | -8.7% | -1.1% | ||
| Appliances | -8.0% | -7.4% | -14.3% | -10.9% | ||
| Equipment, parts & supplies | 0.2% | -0.7% | -8.9% | -1.2% | ||
| Materials | 13.6% | 23.3% | -3.6% | 3.8% | ||
| Services / Repair | -3.8% | -4.3% | -11.0% | -10.7% | ||
| Swimming pools | 0.8% | -6.7% | -8.3% | -9.5% | ||
| Medical | 3.9% | 1.6% | -3.8% | -0.4% | ||
| Office | -10.3% | -3.6% | -6.9% | -3.7% | ||
| Furniture | 26.4% | -11.9% | -24.4% | -12.5% | ||
| Other | 7.3% | 8.6% | 5.4% | 3.9% | ||
| Courier/Delivery Services | -2.6% | -0.6% | -8.5% | -5.8% | ||
| Self-care | 12.1% | 2.3% | 12.3% | 30.5% | ||
| Pet | 3.5% | -0.7% | -4.8% | -3.3% | ||
| Professional Services | 2.6% | 46.7% | -2.1% | 115.7% | ||
| Employment Agencies | 43.5% | 52.5% | 29.8% | 14.1% | ||
| Retail | 3.1% | -0.1% | -6.3% | -2.6% | ||
| Clothing | -13.7% | -6.0% | -24.9% | -9.4% | ||
| Department Stores | -5.4% | -5.8% | -12.2% | -4.5% | ||
| Discount Stores | 21.6% | 2.3% | 9.1% | -2.2% | ||
| Footwear | 4.2% | -2.8% | -7.0% | -8.6% | ||
| Online | 0.0% | 0.0% | 7.4% | 7.1% | ||
| Specialty Retail | -34.7% | -8.3% | -2.5% | -10.8% | ||
| Antique shops | 3.1% | -2.4% | -6.1% | -3.9% | ||
| Florists | -8.1% | -4.3% | -10.8% | -2.4% | ||
| Jewelry | -4.2% | -2.8% | -13.0% | -7.1% | ||
| Pawn Shops | 17.1% | 4.4% | -3.4% | -6.6% | ||
| Secondhand stores | 11.2% | 5.4% | 2.9% | 4.1% | ||
| Luggage | 45.8% | 69.7% | 28.7% | 65.9% | ||
| Sport/Recreation | 4.0% | 2.7% | -1.5% | 3.3% | ||
| Travel | 23.3% | 69.7% | 6.5% | 65.9% | ||
| Agencies | 41.5% | 35.0% | 15.5% | 25.7% | ||
| Airline | 8.5% | 1.9% | -9.6% | -2.4% | ||
| Auto Rental | 7.4% | 9.0% | -2.6% | 5.2% | ||
| Bus Lines | 55.0% | 25.1% | 1.4% | -8.7% | ||
| Cruise | 93.5% | 36.8% | 84.9% | 53.1% | ||
| Lodging | 3.6% | -5.3% | -12.8% | -11.5% | ||
| Taxi/Limo | 29.1% | 17.4% | 12.1% | 9.3% | ||
| Utilities | 6.5% | 3.5% | -1.7% | -0.2% | ||
| Grand Total | 5.5% | 3.5% | -0.4% | 1.3% | ||
What Credit Unions Should Do Now
The higher transaction amounts that consumers spend on groceries online is just one indicator of the changing landscape of payments. For credit unions, providing a comprehensive suite of digital payment options has quickly moved from luxury offering to table stakes. Credit unions members are migrating their payment behaviors to the digital realm, whether its via mobile wallets like Apple Pay, PayPal and Garmin Pay, or paying friends and family digitally through Zelle P2P. Credit unions need to be in the digital game in order to serve their members’ daily transactional needs.
The time has come to commit to an all-in digital payment strategy. For credit unions just beginning their digital payments journey, make a plan to offer new solutions on a rolling, annual basis. Such institutions may wish to begin by offering contactless cards, before launching digital card issuance and Zelle P2P payments. Then, credit unions should look to provider their members with the convenience of digital push to wallet, which will keep a credit union’s credit and debit cards at the top of their members’ preferred digital wallet app – even if their physical card is lost, stolen or reissued.
More information on the Co-op SmartGrowth Consulting Team can be found here.
May 2023 Payments Trends Chart