
Many credit unions find that a formal Primary Financial Institution (PFI) definition is an effective way to measure their most engaged, relevant, loyal, profitable, and “sticky” households (HHs). Whether formally defined or informally outlined, the combination of products and services used to define PFIs are as varied as the institutions themselves. Once PFI consensus is reached, research and analysis are required to understand how the blending of products, services, balances, and ancillary data points paint the PFI picture. When moving from PFI definition to the execution of an actionable strategy, it is worth noting why management teams go through the PFI process.
Two Objectives: Retention and Conversion
Increasing the number of PFI households boils down to two objectives: 1) retention and 2) conversion. As Jeanine Perrone, SVP, Marketing Strategy and Analytics, Marquis, noted in her CU Insight post on March 24, 2022 , ”…2022 is a year to focus on retaining and deepening the relationships of your existing households.” Strengthening relationships with your existing PFI households while converting non-PFI households into PFI status are two strategies to consider.
The foundation for any successful PFI strategy must include research and analysis. And while neither task is particularly glamorous, both are vital steps in developing tactics designed to achieve PFI retention and conversion objectives.
Confirm the Available Data
Once the PFI criteria has been defined, confirm all necessary data points are accessible. Two examples: 1) If direct deposit and mobile banking are key components of the PFI definition, are these data points readily available and accessible on an ongoing basis? 2) Perhaps the presence of a mortgage loan is an indicator of PFI status, yet the institution’s mortgage loans are sold on the secondary market; is the identification of sold/serviced mortgage loans available?
Develop PFI and Non-PFI Profiles
Next, identify the top five percent of households that contain the PFI criteria plus additional criteria such as LifeStage (if available); number of total unique products and services; total balances; and/or total number of loans and deposits. For example, 100,000 households would yield approximately 5,000 top tier (Tier 1) households.
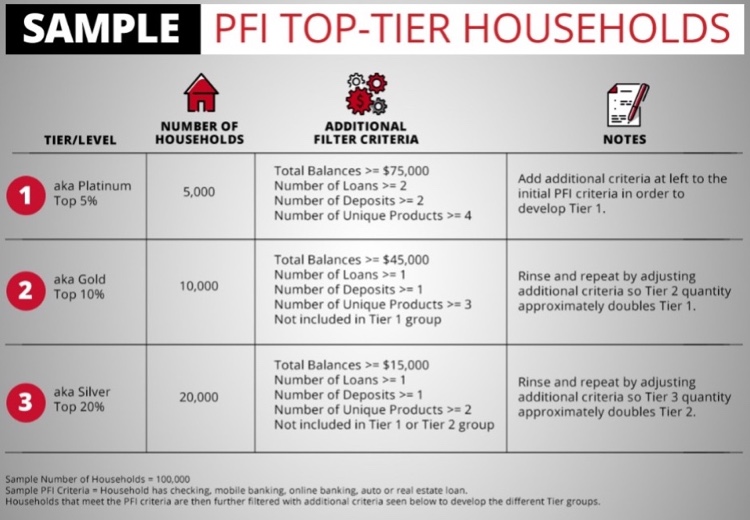
Repeat this process for the next two tiers, adjusting filter conditions as needed to approximately double the quantity in the previous tier. For example, the Tier 2 segment (top 10 percent) should approximately double the Tier 1 quantity and Tier 3 (top 20 percent) should double the quantity of Tier 2.
Review and Analyze
Once the PFI tier segments are identified and quantified, the fun begins: the identification of disparate elements that differentiate the tier segments. Upon review of the data, you will most likely find traits or tendencies beginning to develop; for example, the Tier 3 segment may show low utilization of HELOCs and personal lines of credit; the Tier 2 segment may have paid-down balances of indirect auto loans; or the Tier 1 segment may reflect specific lifestyle stages that push households toward first-time home purchase and used car loans.
Execute & Take Action
Upon completion of analysis, develop a series of actionable tactics that focus on retention and conversion.
Conversion example: If top tier PFI households carry utilized HELOCs, then actively promote home equity lines of credit to lower-tier PFI HHs or perhaps to “look-alike” non-PFI HHs.
Retention example: If low-to-mid tier PFI households carry indirect loans they are paying down, institute a recapture trigger program that actively monitors credit pings for auto inquiries.
Retention example: For PFI households nearing retirement age, remind them that credit union benefits don’t stop working when they do, and provide educational information that helps ease their retirement transition.
Track Results
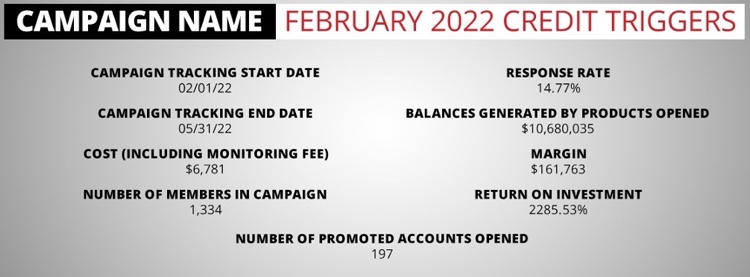
Don’t forget to track results on a regular basis! When tracking campaign activity, calculate response rate, return on investment (ROI), balance growth, and margin. Many credit unions have access to a marketing platform that captures campaign efforts and will provide this level of detail; however, if a marketing platform is not available, don’t despair. ROI, response rates, and balance growth can be tracked via a data extract, a spreadsheet software program, and a few simple calculations.