
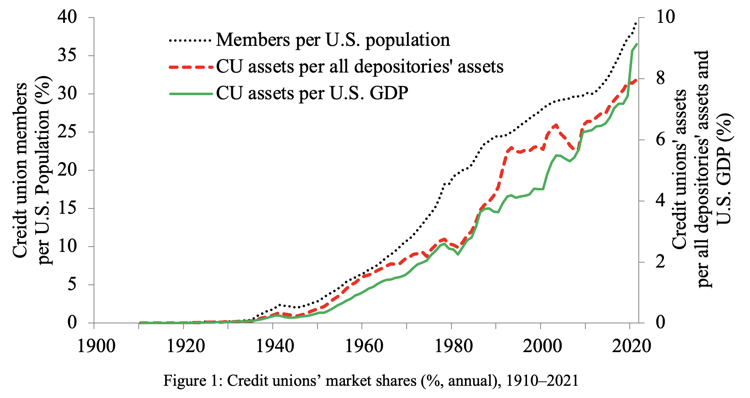
Credit unions play a key and growing role in the financial lives of American consumers. For over one hundred years in fact, as Figure 1 below shows, credit unions have steadily gained market share in the US.
What is it that makes credit unions grow, and what makes some grow faster than others? There are several key drivers of this asset growth, some which affect the credit union system as a whole and are thus largely beyond the influence of individual institutions, and others over which individual credit unions themselves clearly have greater control.
An in-depth review of several of these drivers helps reveal their impact on overall growth.
A Brief History of Credit Union Asset Growth
First, credit unions have grown steadily along with the rest of the US economy. Over the long term, credit unions have grown—in both members and assets—as the population, per capita incomes, wealth, and standards of living in their communities have all likewise increased.
Second, over the long term, credit unions have also gained market share compared with the overall population, the overall economy (e.g., gross domestic product, GDP), or other depository institutions (commercial banks and thrifts), because consumers prefer credit unions to for-profit alternatives. For instance, credit unions provide broad ranges of financial services, from loans to deposits and other services, at more attractive interest rates and terms than banks.
Third, changes in market structure and government regulation can affect credit unions, the pace at which new institutions are formed, and their asset growth rates. While credit unions have continued to gain market share, as they mature, growth rates have slowed (see Figure 2).
During 1910–1933, prior to the launch of the federal credit union charter, credit unions held a very small share of all depositories’ assets, averaging just 0.02%. As more credit unions were launched, however, assets grew very quickly, like startups, averaging inflation-adjusted annual asset growth rates of 94%.
During 1934–1970, from the launch of the federal charter to the launch of federal insurance for credit union shares, credit unions continued to increase their market share, averaging 0.91%. As more mature institutions, however, their growth rates slowed, averaging only 15%.
During 1971–1997, from the launch of federal insurance to the introduction of minimum capital requirements per assets, credit unions further increased their market share, averaging 3.6%. Growth rates again declined, to just 6.3%, likely as regulators shifted their priorities from encouraging new charters to minimizing failures.
During 1998–2021, credit unions gained an even greater market share, averaging 6.5% by this point, but growth rates fell even more, averaging only 5.2%, this likely the result of new capital requirements further restricting new charters and requiring credit unions to set aside more reserves as they grew their assets.
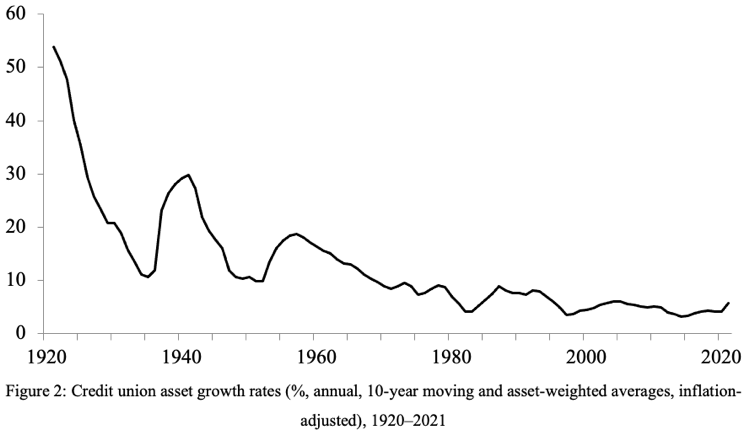
Fourth, credit union asset growth rates often fluctuate along with governments’ macroeconomic policies. Historically, economic recessions, financial crises and, most recently, the Covid pandemic have been met with expansionary monetary policies resulting in large deposit inflows to credit unions. Thus, the recessions of 1982, 1990, 2001, 2008, and 2020 largely coincide with periods of particularly fast credit union asset growth.
Asset Growth Drivers Credit Unions Can Control
While changes in macroeconomic conditions and policies, interest rate and credit cycles, and government regulation are all beyond the control of individual institutions, each credit union does still have direct control over many elements of how its operates. These include the range of products offered, how much interest rates differ from competitors’, underwriting policies across credit score ranges, the size of its workforce and branch network, its marketing expenses, its field of membership, and many more managerial choices.
To assess the impact of such decisions, we updated earlier studies about what factors contribute to credit union asset growth that had been performed for the National Credit Union Administration (NCUA) and the Filene Research Institute.
After considering (1) growth rates across thousands of individual credit unions during 1980–2020; (2) hundreds of variables for which data were readily available and that potentially might have been drivers of asset growth; and (3) how the importance of these drivers might differ across asset size ranges, we concluded that credit unions have at their disposal several key, proven, drivers of asset growth. They include:
- Deposit benefits, or the extent to which a credit union pays higher interest rates on deposits than banks;
- Having large, or expanding, fields of membership;
- Having large, or expanding, workforces (per assets);
- Having large, or expanding, branch networks (per assets);
- Having large, or expanding, core (loan or deposit) product offerings; and
- Having large, or expanding, marketing expenses (per assets).
We did not find positive, large, or statistically reliable impacts on asset growth from loan benefits, adding more non-core offerings, and changes in types of loans or deposits.
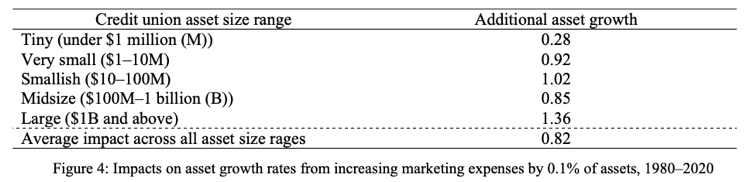
The drivers of credit union asset growth that we identified as strongest and most proven across time periods as well as across asset size ranges were deposit benefits and marketing expenses (i.e., educational and promotional expenses). Again, offering large deposit benefits (paying higher interest rates on deposits) had strong positive impacts on asset size growth. According to our analysis, during 1980–2020 credit unions that increased their interest rates on deposits by 1% more than banks achieved asset growth rates that were, on average, 2.2% higher.
We found these impacts to be reliably positive across asset size ranges, and during all but one of the years explored. That one exception was 2020, when Covid-related fiscal and monetary policy resulted in large inflows of deposits for nearly all credit unions. (The necessary data to analyze 2021 in full are not yet available.)
Marketing Expenses are the Strongest, Most Proven Driver of Asset Growth
While paying higher interest rates on deposits reliably resulted in higher asset growth rates across time periods and asset size ranges, we found that increasing marketing expenses per assets had far larger impacts on asset growth rates, and that the impacts were (1) quite consistent across asset size ranges; and (2) have grown in recent decades.
The impact of marketing is all the more important since these expenses, as reported in call reports, are relatively small. For instance, in 2020, marketing expenses accounted for an average of just 0.10% of all credit union assets, or 3.5% of noninterest expenses. This implies that large increases in marketing expenses (e.g., a doubling of the budget) could be readily accommodated with relatively small impacts on ROA, or by reducing other expenditures, such as interest expenses. (Note that marketing budgets, as reported in NCUA call reports, do not include compensation paid to employees of in-house marketing departments.)
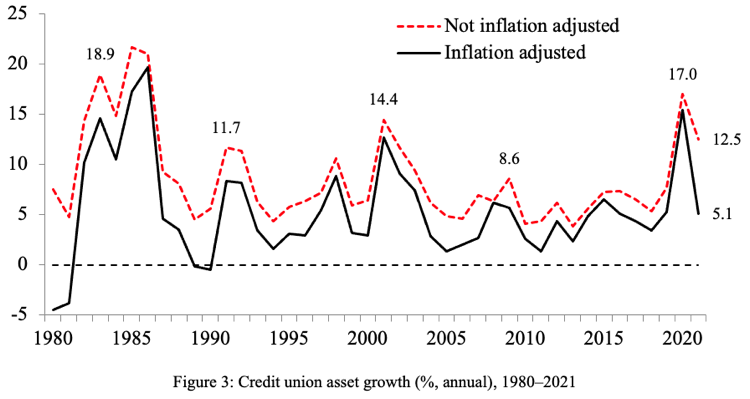
According to our analyses, during 1980–2020 credit unions that increased their marketing expenses by 0.1% of assets (doubling the average budget) achieved asset growth rates that were, on average, 0.82% higher. We found these impacts to be reliably positive across asset size ranges (see Figure 3), and to be reliably (i.e., statistically significant) positive for every year since 1994.
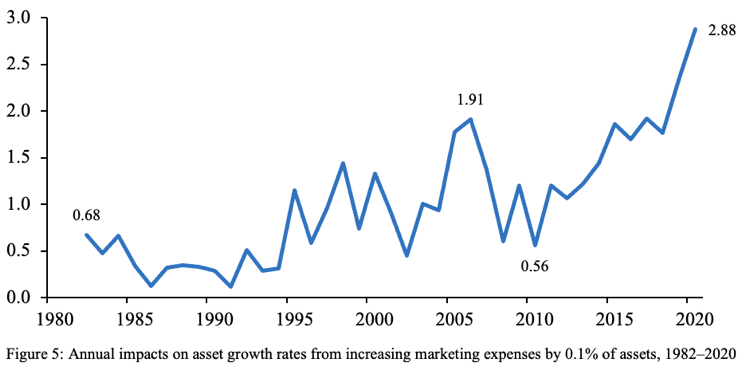
Moreover, the impacts of marketing expenses on asset growth are growing larger (see Figure 4). For example, the impacts of increasing marketing expenses by 0.1% of assets have increased from an additional 0.68% in asset growth in 1982 to an additional 2.9% in asset growth in 2021, perhaps because expenses put toward more modern, better targeted, online and social media marketing are more effective than more traditional forms of marketing.
Final Takeaway
In closing, spending on marketing seems to have a far greater “bang for the buck” than paying members higher interest rates on deposits. Again, increasing marketing expenses by just 0.1% of assets on average increased asset growth by 0.82%. In contrast, increasing deposit benefits by 0.1% on average increased asset growth by the far smaller amount of 0.22%.
How, then, should credit unions allocate their resources? What are their goals, and should asset growth be the overarching goal? Credit unions have diverse memberships with at times potentially conflicting interests and must therefore balance how to apportion the benefits they provide across, for instance, borrowers, depositors, other financial consumers, and current vs. potential members.
Ultimately, credit unions should focus primarily on serving their members. To do this well and to grow, they must provide good service at attractive rates. While asset growth should not be the overarching goal, credit unions that serve their members well will also grow. However, the proven higher bang for the buck from marketing expenses reminds us that it is not enough to provide good service and rates. Credit unions must also engage in marketing efforts to inform current and potential members that they provide broad ranges of products, good service, and good rates.