The National Credit Union Administration (NCUA) released its Q1 2021 data. Here are some key performance indicators:
- Total loans outstanding increased $49 billion, or 4.4%, over the year ending in the first quarter of 2021 to $1.17 trillion.
- Total assets rose by $311 billion, or 19%, over the year to $1.95 trillion.
- Net income was up $11.3 billion, or 134.9%, to a total of $19.7 billion in Q1 2021 compared to the same period a year ago.
As we drilled down into the data, we found a few trends that shine a light on where we are and what the future might hold.
Here are our three main takeaways.
Delinquency Is Down—A Lot—And Charge Off Rates Are Down As Well
The delinquency rate at federally insured credit unions was 46 basis points in the first quarter of 2021, down 17 basis points compared with the first quarter of 2020.
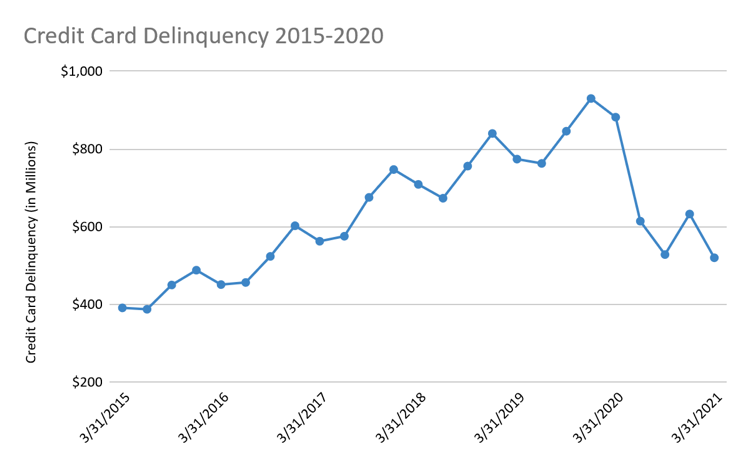
Credit card delinquency fell 48 basis points, dropping to 89 basis points from 137 basis points one year earlier.
The net charge-off ratio for all federally insured credit unions was 32 basis points in the first quarter of 2021, compared with 58 basis points in the first quarter of 2020—a decrease of 26 basis points.
2020 Analytics Insight
Lower delinquency and charge-off rates are paradoxical to what you expect in a recession caused by a global pandemic. This speaks to the robust and timely response by the government and financial institutions. Pandemic-related payment deferral programs gave borrowers who were affected by pandemic a helping hand. The decrease in delinquencies and charge-offs shows us these programs worked, especially for borrowers who, in normal economic times, may have become delinquent.
Pandemic assistance also helped borrowers less economically affected by COVID. Thanks to several rounds of stimulus payments from the US government, these borrowers had extra money and were less likely to become delinquent.
But Allowance for Loan Loss (ALLL) Increased
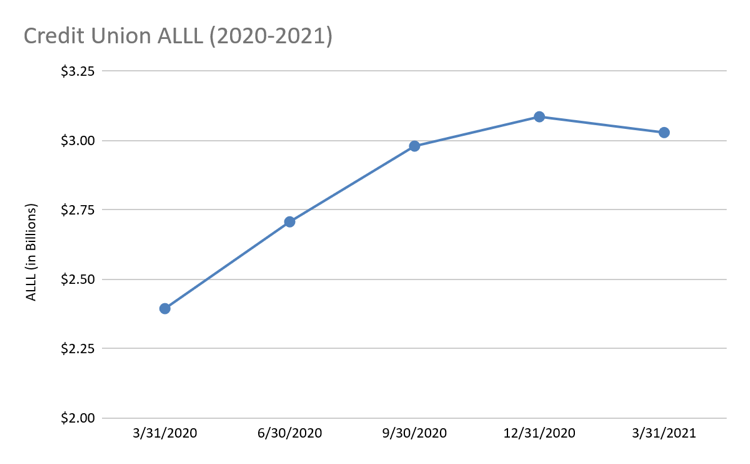
Allowance for Loan Loss increased from Q1 2020 to Q1 2021. It increased each quarter of 2020, but saw a small dip in Q1 2021 compared to Q4 2020.
2020 Analytics Insight
The fact that the ALLL increased year over year while delinquency and charge-off rates decreased implies credit unions are concerned that we’re not out of the woods yet. There’s still risk out there—we live in a global economy and are still living through a global pandemic.
The pandemic was unprecedented and credit unions have shown they are well adept to help their members in time of need. Through the worst (hopefully) of the pandemic in 2020, credit unions increased their ALLL, based on the expectation that charge offs would increase which were never realized.
Credit unions are still playing it conservative, and with good reason. There are still accounts receiving deferrals due to COVID-19 hardship. Because of aforementioned payment deferral and stimulus programs, the remaining accounts still in hardship may represent a riskier pool of borrowers when compared to the prior pool in hardship.
Loan Growth Was Up—But Was It?
Loans secured by 1- to 4-family residential properties increased $23.3 billion, or 4.8%, to$511.4 billion in the first quarter of 2021.
Overall, auto loans increased $6.4 billion, or 1.7%, to $380.7 billion. But new auto loans fell $5 billion, or 3.4%, to $140.0 billion.
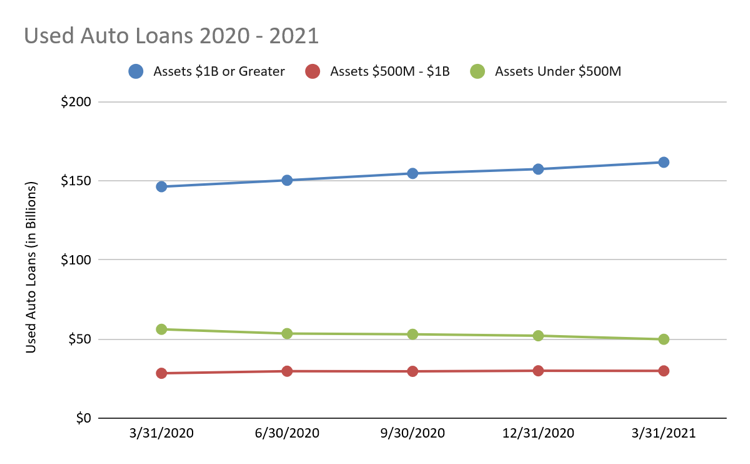
Used auto loans were up overall, but only for credit unions with assets >$1 billion.
Credit card balances declined $5.7 billion, or 8.9%, to $58.7 billion.
2020 Analytics Insight
Loan growth was up for first mortgages due to refinancing, which was spurred by the low interest rate environment. Low interest rates also helped increase the used auto loans, but low new car inventory and high prices kept consumers away from new vehicles.
Most of the loan growth between Q1 2020 and Q1 2021 was for credit unions with assets >$1 billion. Loan volume for credit unions under $1 billion in assets remained mostly flat.
The Fed met in June and did not raise interest rates, citing lack of evidence that inflation concerns are broad and an expectation that prices will ease as supply chains correct. Continued low rates could motivate borrowers to refinance, but that pool may have dried up after the boom in 2020.
Conclusion
As we continue to see improvements in the economy, there are still uncertainties. Data from Q2 2021 will give a better understanding of the status of borrowers and help get a clearer picture of trends moving forward.
Want to see how your credit union compares to your peers? The 2020 Analytics Call Report Analysis provides actionable insights into the Call Report data. Compare key metrics including ROA, delinquency and charge off rates, profitability, and more. See it in action, request a demo today.