
2018 was another year marred with global uncertainty. Economic and political instability at home and abroad was constant throughout the year, leaving the markets in flux. While the economy continued to grow, economists’ and the Fed’s forecast growth will slow in 2019 by upwards of 0.7 percent, and continue to trend lower into 2020, upwards of 1 percent. To further add to the uncertainty, both political parties remained in grid lock; coupled with a government shutdown and a perpetual message of doom and gloom by the mainstream media which is weighing financially and emotionally on the country. The precariousness of the market adds fuel to this uncertainty, creating concern which is starting to weigh on consumer sentiment. Yet, behind the scenes trade has moved to the forefront with U.S. striking new agreements with Canada and Mexico and continually negotiating with Europe and China. Also, in September, the U.S. surpassed Russia and Saudi Arabia as the largest global oil producer. In other economic news, the stock market took a step back from its all-time highs, along with an estimated 2.3 percent GDP growth for 2019, and historically low unemployment. Due to the perception of a stronger economy, the Fed increased rates three times in 2018 and has signaled more gradual rate increases in 2019, albeit at a slower rate than 2018. Having said that, they’ve also communicated that, depending on economic factors and global uncertainty, they could remain unchanged until 2020.
Federal Open Market Committee (FOMC) - Rate Hikes
The FOMC continues to provide clear communication regarding rate intentions coupled with controlled execution, resulting in stability and methodical reaction by the financial community. Entering the fourth year of the rising rate environment, economists are signaling that the Fed may be close to the end. The yield curve has inverted between the two and five year treasury and is within 25bps of inverting between the two and ten year treasuries. Historically, the market looks for inversion between two years and ten years as an indicator of a potential recession. The market will watch the fed closely in 2019 as an indicator of things to come. Financial institutions are once again in a position not seen in over a decade; the potential of a flat or inverted yield curve. Now, financial institutions are faced with having to protect margins on current assets and fund new growth in a tight funding market.
Regulatory Factors
From a regulatory standpoint, 2018 was an important year for financial institutions, particularly community banks. Back on May 24, President Trump signed the Economic Growth, Regulatory Relief and Consumer Act into law.
Some of the major takeaways of this bill include:
- An exemption from the Volker Rule for insured depository institutions and their affiliates with less than $10 billion in consolidated assets and low levels of trading assets and liabilities.
- Modifications to the Federal Banking Agencies’ Liquidity Coverage Ratio (LCR) relating to the treatment of certain municipal securities.
- Elimination of Dodd-Frank company stress testing requirements for BHCs, banks and other financial companies with assets under $250 billion.
- An exemption from the U.S. Basel III capital requirements for smaller banking organizations that maintain a “Community Bank Leverage Ratio” of at least 8 to 10 percent.
- Relief for smaller institutions relating to supervision, examination and regulatory reporting
- Modifications to the classification of most reciprocal deposits as non-brokered.
The focus of this regulation was to allegedly “even the regulatory field” for community banks, who have often voiced the burdens of the Dodd-Frank regulation – which was geared toward larger financial institutions. Financial institutions, especially community banks and credit unions, have been anxiously awaiting regulatory relief, however, significant resources have already been deployed which will continue to weigh on community banks for years to come. The regulatory relief to-date has allowed financial institutions to allocate more resources to making loans and supporting the community, which should stimulate growth. However, with the changing of leadership in the House of Representatives, additional regulatory relief will likely be muted.
Deposit Factors
Throughout 2018, a major theme among financial institutions was to grow or maintain deposits. Three years into the rising rate environment, depositors began to become more rate sensitive, forcing many financial institutions to increase the beta on their deposit products.
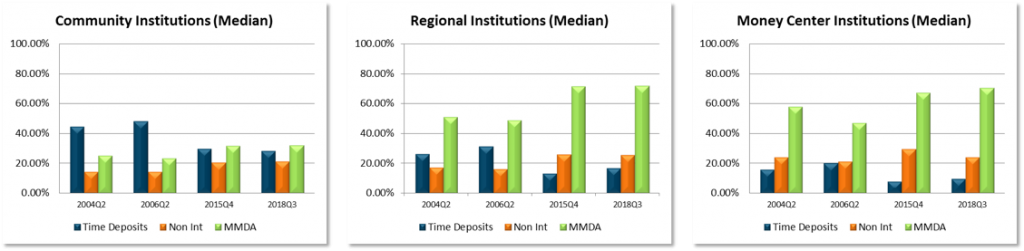
Graphic 1
Graphic 1 above highlights the changes in deposit types (Time Deposits, Non-interest Deposits, and MMDA Deposits) for community, regional and money center financial institutions, and compares the last rising rate cycle (2004Q2 through 2006Q2) to our most recent rising rate cycle that started at the end of 2015. There are a few major observations from these charts. First, during the last rate cycle, all financial institution sizes saw a decrease in MMDA Deposits and growth in Time Deposits. However, during this cycle we are seeing something different play out. In large part, community financial institutions have not changed their deposit make-up thus far in this cycle. However, both regional and money center financial institutions have seen growth in time deposits. Furthermore, non-interest deposits have held steady at both community and regional institutions, while money center institutions have seen about a 5 percent decrease in these types of deposits. This is most likely due to the vast hoard of non-interest deposit money center institutions satiated during the financial crisis. Another interesting trend emerging for money center institutions is the growth in MMDA deposits during this cycle, as compared to about a 10 percent decrease during the last rate cycle.
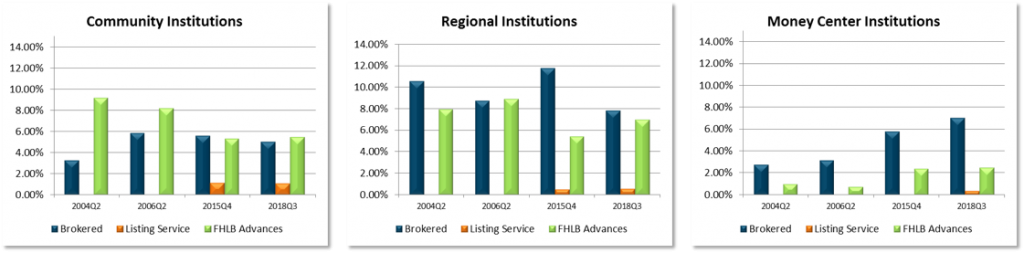
Graphic 2
Switching gears a bit, and looking at wholesale funding vehicles in Graphic 2 (brokered deposits, listing service deposits, and FHLB advances), we can see some trends on how financial institutions have been funding recent deposit growth. The time periods again compare the past rising rate cycle to the current. During the last rate cycle, you’ll notice community financial institutions took on more brokered deposits along with FHLB advances. However, currently they’ve slightly reduced their usage of brokered deposits from the beginning of this rate cycle and have been muted in general in using wholesale funding. Regional financial institutions have behaved similarly during last cycle by reducing brokered deposits and increasing usage of the FHLB. Notably, to a larger degree than the last cycle, money center institutions are using larger amounts of brokered deposits and listing service deposits. The usage of listing service deposits for money center institutions is an emerging trend as their usage of this type of deposit was negligible at the beginning of this rate cycle. Also, it is not a surprise as much with what has been written about large financial institutions launching high-rate online accounts to leverage technology, aggregating deposits and optimizing their deposit gathering abilities.
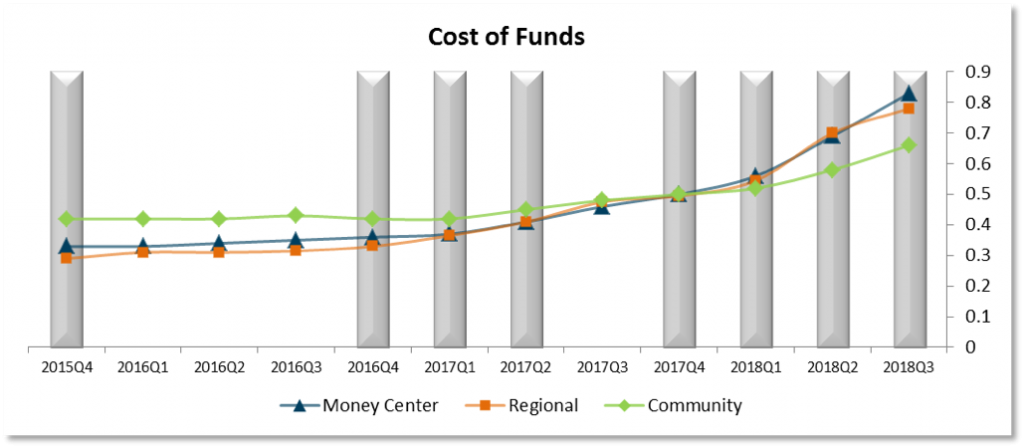
Graphic 3
A final item to highlight from 2018 was the growth in deposit betas for all financial institutions. Graphic 3 above shows the cost of funds on a quarterly basis for all financial institutions, with the bars highlighting the quarter a rate hike occurred. As you can see, 2018 marked the beginning of more aggressive deposit betas, with money center financial institutions being the most aggressive, followed almost lock-in step by regional financial institutions.
Conclusion
From a financial institution perspective, 2018 was consistent with 2017 on a number of fronts. The Federal Reserve continued its path to return interest rates to a more “normal” level, which allows institutions to continue an increase in margins. With the signing of the Economic Growth, Regulatory Relief and Consumer Act, community banks and credit unions should experience regulatory relief, allowing them to grow loan balances and open up new business opportunities. Deposits became a hot topic in 2018 with financial institutions deploying new strategies to maintain or grow their deposit balances in a more competitive rate environment. Lastly, tax reform stimulus fueled economic growth in 2018 to levels not seen in over a decade, but the long-term effects shall remain to be seen.