
The Home Mortgage Disclosure Act (HMDA) requires financial institutions to maintain, report, and publicly disclose loan-level information about mortgages. The reported data:
- Helps show whether lenders are serving the needs of their communities
- Is used to inform government decisions and policies
- Sheds light on potentially discriminatory lending patterns
HMDA data is a rich source of insights to understand the mortgage lending market and each institution’s relative performance. 2020 Analytics takes the publicly available data and puts it into actionable insights on their TTAData Vision Portal. Here are some credit union-specific insights we found in the recently released HMDA data, reported for the previous year.
Comparing 2019 and 2020
Total originations increased from $2.45 billion in 2019 to $4.24 billion in 2020, but the market share for credit unions remained steady, right around 5%
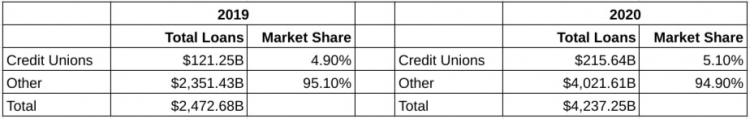
Credit union market share.
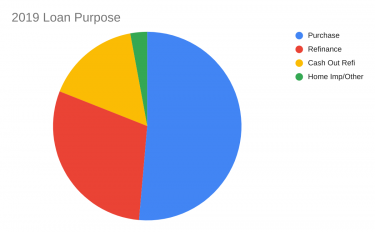
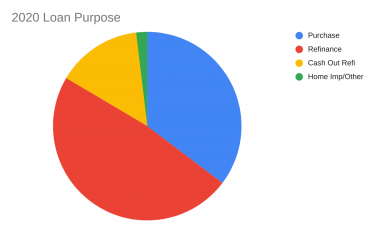
Refi Boom
Not surprisingly, the purpose of loans shifted from 2019 to 2020. In 2019, the majority of loans were purchase loans. In 2020, refinances were the dominant loan purpose due to low interest rates. Credit unions can likely expect refinance volume to decrease after 2020 and will need to expect lower volume as refinances become slower paced.
County Breakdowns
When we break down credit union originations by county, the ranked list by amount aligns pretty closely with size of the housing market in that county. LA and San Diego are huge housing markets, so it’s no surprise they’re at the top of the list because of sheer volume.
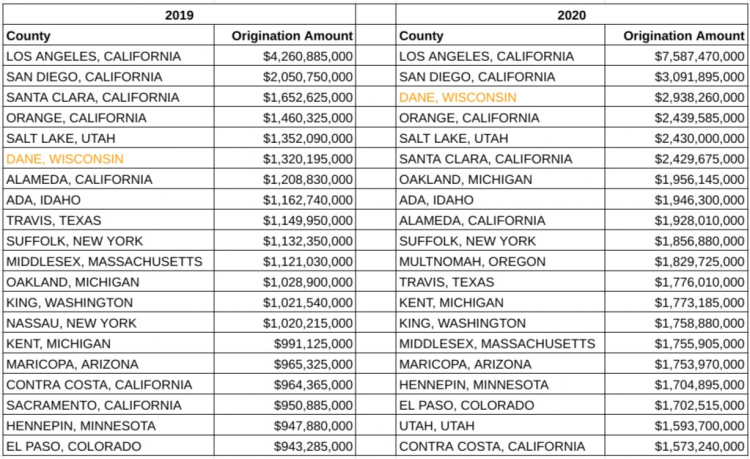
Top counties by credit union originations.
Notable, however, is Dane County, Wisconsin, home to the modern day credit union movement. It’s a small real estate market but it accounts for an out-sized share of credit union originations. In 2019, the county was the 6th largest for credit union originations, and in 2020, that county improved to 3rd. Remember, these numbers don’t adjust for population or total originations. While credit union originations made up approximately 3% of LA and San Diego county originations, credit unions accounted for 25.7% and 30.9% of Dane County originations in 2019 and 2020, respectively.
While Dane County hits the top 10 in dollar amount for credit union originations, it doesn’t make it into the top 10 for credit union market share.
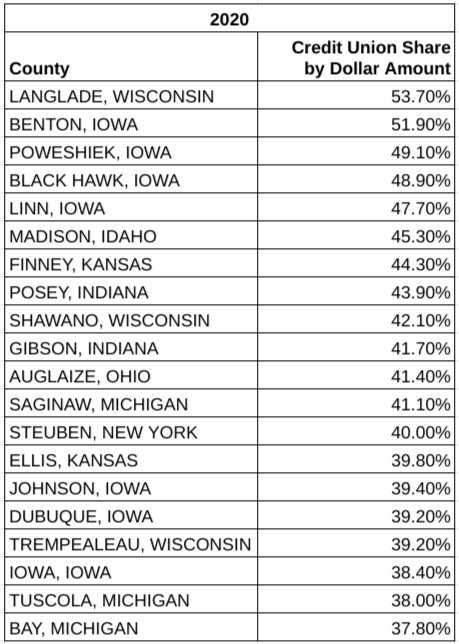
Top counties by market share. Only includes counties with >$100MM in total originations.
In Langlade County, Wisconsin, and Benton County, Iowa, more than half of all originations by dollar amount are completed by credit unions and almost all of the top counties by market share are in the Midwest.
Fair Lending: How Credit Unions Performed
A core purpose of the HMDA data is to analyze whether institutions are meeting the needs for lending to protected groups.
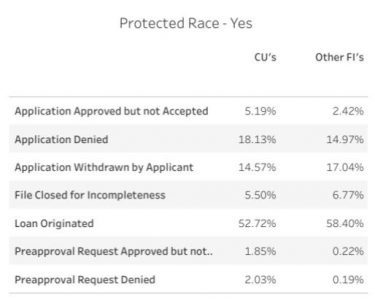
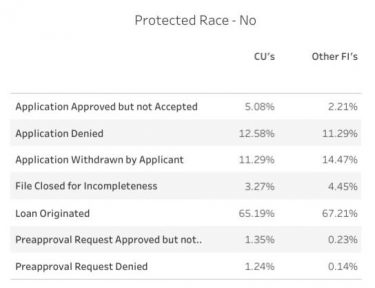
Protected Race Applications
When we compare loan applications by protected or not-protected race, the results are similar for credit unions and other financial institutions. However, they do deviate in “Applications Denied” and “Loans Originated,” with credit unions denying a higher percentage of protected class applications and originating a smaller percentage of protected class loans compared to other financial institutions, as shown below.
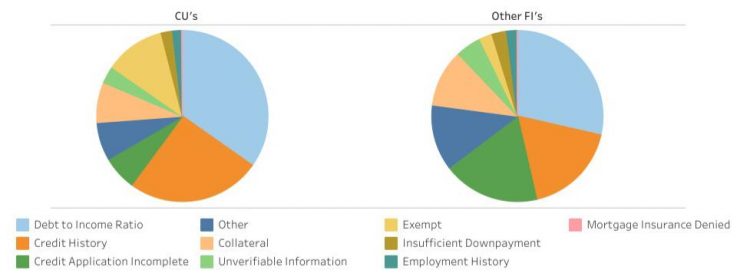
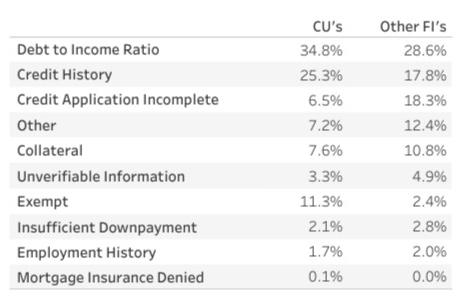
Denial Reasons
When credit unions deny loan applications (for all classes), the vast majority are because of debt-to-income ratio and credit history. Banks also use those two denial reasons most frequently, but have a wider range of reasons they indicated for denial.
Young and Low-income Borrowers
Credit unions lag other financial institutions in approving loans for low-income borrowers. They also approve fewer applications for younger age groups. The discrepancy is especially visible for millennial-aged (<34) applicants with income under $30,000, as shown below.
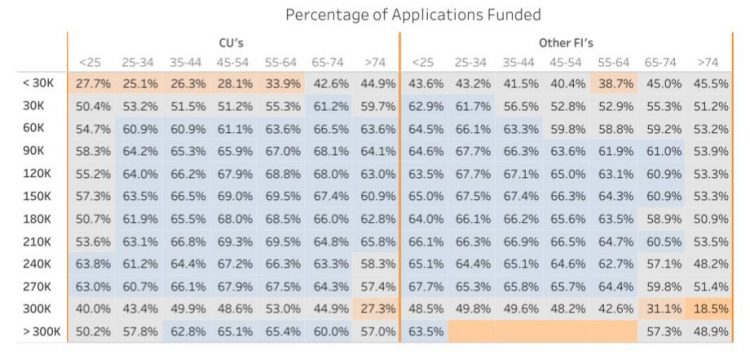
Credit union loan originations overall skew toward older and higher income than other financial institutions, even as millennials have the largest home-buying age group. A sharper focus toward approving millennial borrowers can help credit unions increase their mortgage lending volumes and overall portfolios.
See How You Compare
HMDA data visualizations are now available with your TTAData Vision Portal subscription. See fair lending reports and quickly analyze how you stacked up against peer institutions in 2020.