Given the rising rate environment, many investors are looking for ways to mitigate their interest rate exposure, often investigating floating-rate assets. As discussed previously in our first article, Floating on Rising Rates to Success, from April 2022, this requires a framework to compare fixed against floating assets, as well as a way to compare floating-rate assets with differing rate reset characteristics. The quantitative underpinnings of the lower interest rate sensitivity for floaters was discussed through the familiar concept of duration, noting that duration for floaters corresponds approximately to the time to next reset of the instrument. We also noted that this process was merely an approximation that usually suffices, and that other, more rigorous, methodologies are needed to differentiate between floaters with varying reset periods and maturities. Many investors compare and contrast these assets by utilizing forward rate information embedded within the yield curve.
The Yield Curve: What It Is and What It Implies
To comprehensively analyze floating-rate instruments it is not sufficient to only compare them to a fixed rate loan with a maturity equal to the reset period of the floater. Generally, most investors do not view a 10-year floater with a monthly rate reset period to be the same as a 1-year floater with the same rate reset period or a 1-month fixed-rate term loan. The differences in these instruments can become more apparent once one extracts information from the yield curve(s) about future interest rate movements.
When we refer to the yield curve, most readers will first think of the best known example in the US -- the Treasury yield curve, which reflects the fixed rates that investors demand for various maturities when facing the US Government as a counter-party. The Treasury yield curve is almost always the lowest of any US-dollar yield curves and is considered to define the risk-free rate of interest. However, other yield curves can also be constructed - one yield curve of particular importance when analyzing floaters is the LIBOR[1] swap curve, which is the curve that reflects the fixed rates that a highly-rated financial institution would pay to, or swap with, another highly-rated financial institution counter-party in exchange for floating rate LIBOR payments over a given period. For instance, the 1-year swap rate is the fixed rate investors are willing to pay (or receive) in exchange for receiving (or paying) quarterly payments of 3-month LIBOR for the next year from a highly-rated financial institution counter-party.
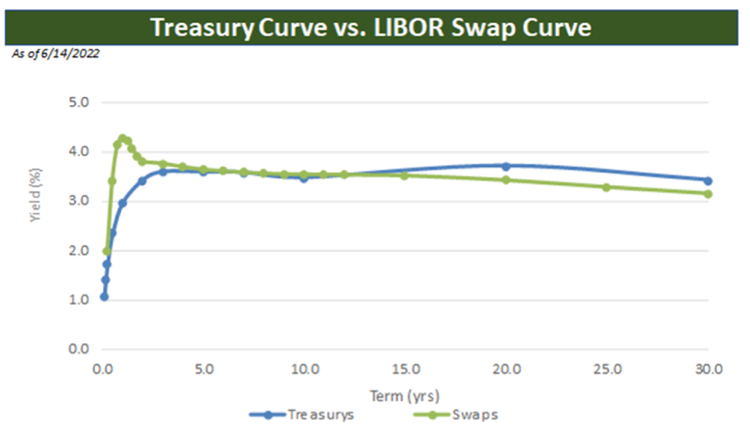
Source: Bloomberg
Implied in the yield curve are two additional measures of interest rates - spot rates - the rate required to various maturities if there were no payments of interest until maturity - and forward rates - the expected path of interest rates for each maturity. For analyzing floaters and comparing them to fixed rate instruments, one needs to extract forward rate information from the yield curve(s). We will explain how to undertake this exercise using the Treasury yield curve but for lending rate decisions made by many financial institutions the swap curve may be more appropriate.
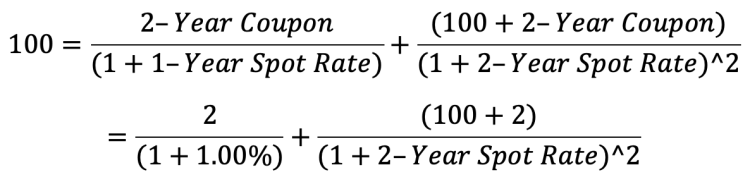
For ease, let’s assume that all Treasury securities pay interest annually and the coupon on the 1-year Treasury is 1% and the 2-year Treasury is 2%. Further, we will assume both securities are priced at 100 (par), and therefore the yields are the same as the coupons. The spot rate for the 1-year Treasury is the same as its yield as there is only a single payment at the 1-year point, but what is the 2-year spot rate? The formula that needs to be solved is:
Rearranging gets:
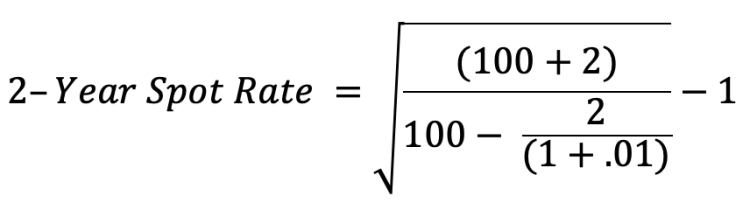
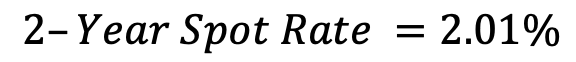
Which results in:
Now that the spot rates are known, we can calculate the forward rates. As mentioned, forward rates are the future rates implied by the yield curve. These can be of any maturity and at any point in the future, such as the 5-Year Spot Rate, 2-Years Forward, etc, with extrapolation beyond the longest Treasury possible.
For example, using the same assumptions as above, what is the 1-year spot rate, 1-year forward, i.e., what rate are investors implying that they expect in 1-year on the 1-year Treasury? The formula that needs to be solved in this case is:

Rearranging gets:
![]()
Using the above numbers results in:
![]()
Fundamentally, if you are going to earn roughly 2% over two years and are only earning 1% for the first year, you would need to earn about 3% for the second year to achieve that 2% annualized cumulative return over that period. Critically, it is important to note that this is just the current market’s expectations; there is no guarantee this forward rate will be realized.
Returning to analyzing floaters, which are often tied to LIBOR, one starts with the swap curve and constructs a corresponding forward curve for LIBOR of the desired term in a similar manner as done above with Treasuries. Next, expected cashflows for the floating-rate asset are forecasted using the appropriate forward rates at each interest-rate reset along with any other assumptions (prepayment rate, default rate, etc.) necessary to analyze the asset. Once the expected cashflows are generated, the yield on the asset can then be calculated and compared directly with that of a fixed-rate asset or floating-rate assets of differing maturities.
As an example, imagine we had two 5-year bullet-maturity assets, one fixed-rate and one a floater with annual resets off 1-year LIBOR. Both are priced at spreads of 100 over interest rates, LIBOR in the case of the floater and swaps in the case of the fixed-rate. Further, let’s assume the curve for swap rates in the table below and their associated spot and forwards rates. For simplicity, we’ll also assume only annual payments occur on swaps as well as both assets. The initial coupon on the floating-rate asset is lower than that on the fixed, despite the two assets having the same exact pricing spread, and therefore any yield or return analysis that is based solely on the initial rates and coupons would make the floater look unattractive. However, this is an unfair comparison; the reason the fixed-rate asset has a higher coupon is because longer rates are higher, meaning that expectations are that short-term rates will rise. To leave that out of the analysis is inconsistent with the information in the yield curve.
As the following analysis shows, when forward rates are taken into account, the yield on the floater is nearly identical to that of the fixed-rate asset, with the minor difference attributable to the spread added to the rates being used to set the coupons; if the spread were 0, the yields would be identical.
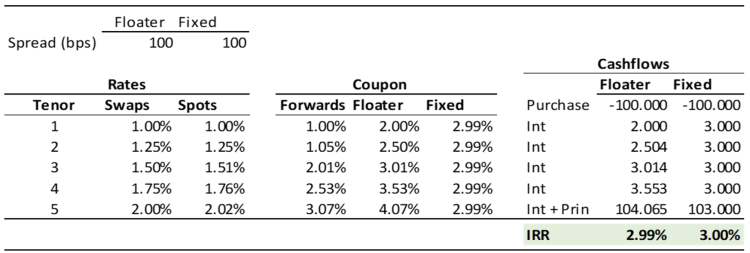
A very close approximation of this analysis for par-priced assets can be achieved by adding the spread to the swap rate at the floating-rate asset’s WAL. In this example, 2% + 100 bps spread = 3% yield. The more the asset resembles a bullet maturity, the closer the results will be to the more detailed analysis.
One popular rate that does not have an explicit forward curve is the Prime rate, which is used by many banks and credit unions as the rate used to reset HELOCs. However, Prime tends to move in lockstep with Fed Funds, so the Fed’s dot plot, Wall Street analysts’ street consensus or Fed Funds futures can be used to help set expectations here (for those with access to Bloomberg, the WIRP command will calculate this using futures contracts), with the caveat that Prime generally moves in 25 basis point increments, so the expected rate should be rounded to that precision. This allows for a similar analysis to what was outlined above for assets based on Prime.
Conclusions
The comprehensive solution to comparing floaters to fixed-rate instruments ultimately lies in information embedded in the yield curve(s) and does admittedly require an analytical lift. It is the full yield curve analysis that allows us to answer for any principal paydown schedule in the current rate environment, what fixed rate of interest is worth the same as receiving floating rates over the same period and gives us the basis for comparing assets of different maturities and interest types. However, if one does not wish to or can not undertake a full yield curve analysis, significant comparison accuracy is achievable when one remembers that a floater’s duration is approximately equal to its reset period and that its equivalent yielding fixed-rate counterpart can be found using the swap curve with an appropriate credit spread.
Co-authored by Eric Marcus and Michael Lanzarone
[1] LIBOR is in the process of being replaced as the global US dollar floating rate benchmark by the Secured Overnight Financing Rate (SOFR).